
Like many of our users, you may have started exploring synthetic data because your real data contains sensitive information. In fact, many customers first find us when working with GDPR, or other regulations that make it difficult to share real data. They know that synthetic data makes it possible to share and work with useful information while protecting user privacy. But when it comes to synthetic data uses, privacy is only the tip of the iceberg. Working with customers all over the world has taught us about one important, but often overlooked benefit of using synthetic data: increased data diversity.
Data diversity refers to the overall variety of data that is accessible for a project. While it's a simple concept, increasing data diversity can deliver enormous value to an organization — allowing for more robust testing, better predictions, and even higher creativity. In this article, we'll walk through the ins and outs of data diversity, and share some key insights:
- A synthesizer can create synthetic data that is diverse enough to be competitive with randomly generated data. This means it's producing many different combinations of valid data points.
- If introduced sparingly, data diversity won't adversely affect data quality. Unlike fully random data, synthetic data produced by SDV realistically matches column shapes and correlations from the real data.
- Different types of synthetic can be diverse – ranging from single tables, to multiple connected tables in a data schema, to sequences of data.
To start, let's go through how synthesizers produce diverse data in the first place.
How does a synthesizer produce diverse data?
When creating synthetic data, we start out with a real dataset. A synthetic data software, such as SDV, uses a generative AI model to learn the general patterns within the real data. In the example below, we are working with real census data that contains personal, residential, and occupational information about many different individuals. The SDV software looks at this data and learns patterns such as the general income range, how it changes based on location, etc.
Once those patterns have been captured by the generative AI model, they are then saved in a synthesizer. At any point in the future, we can use this synthesizer to create synthetic data that resembles the original data, without needing to access the original data at all.
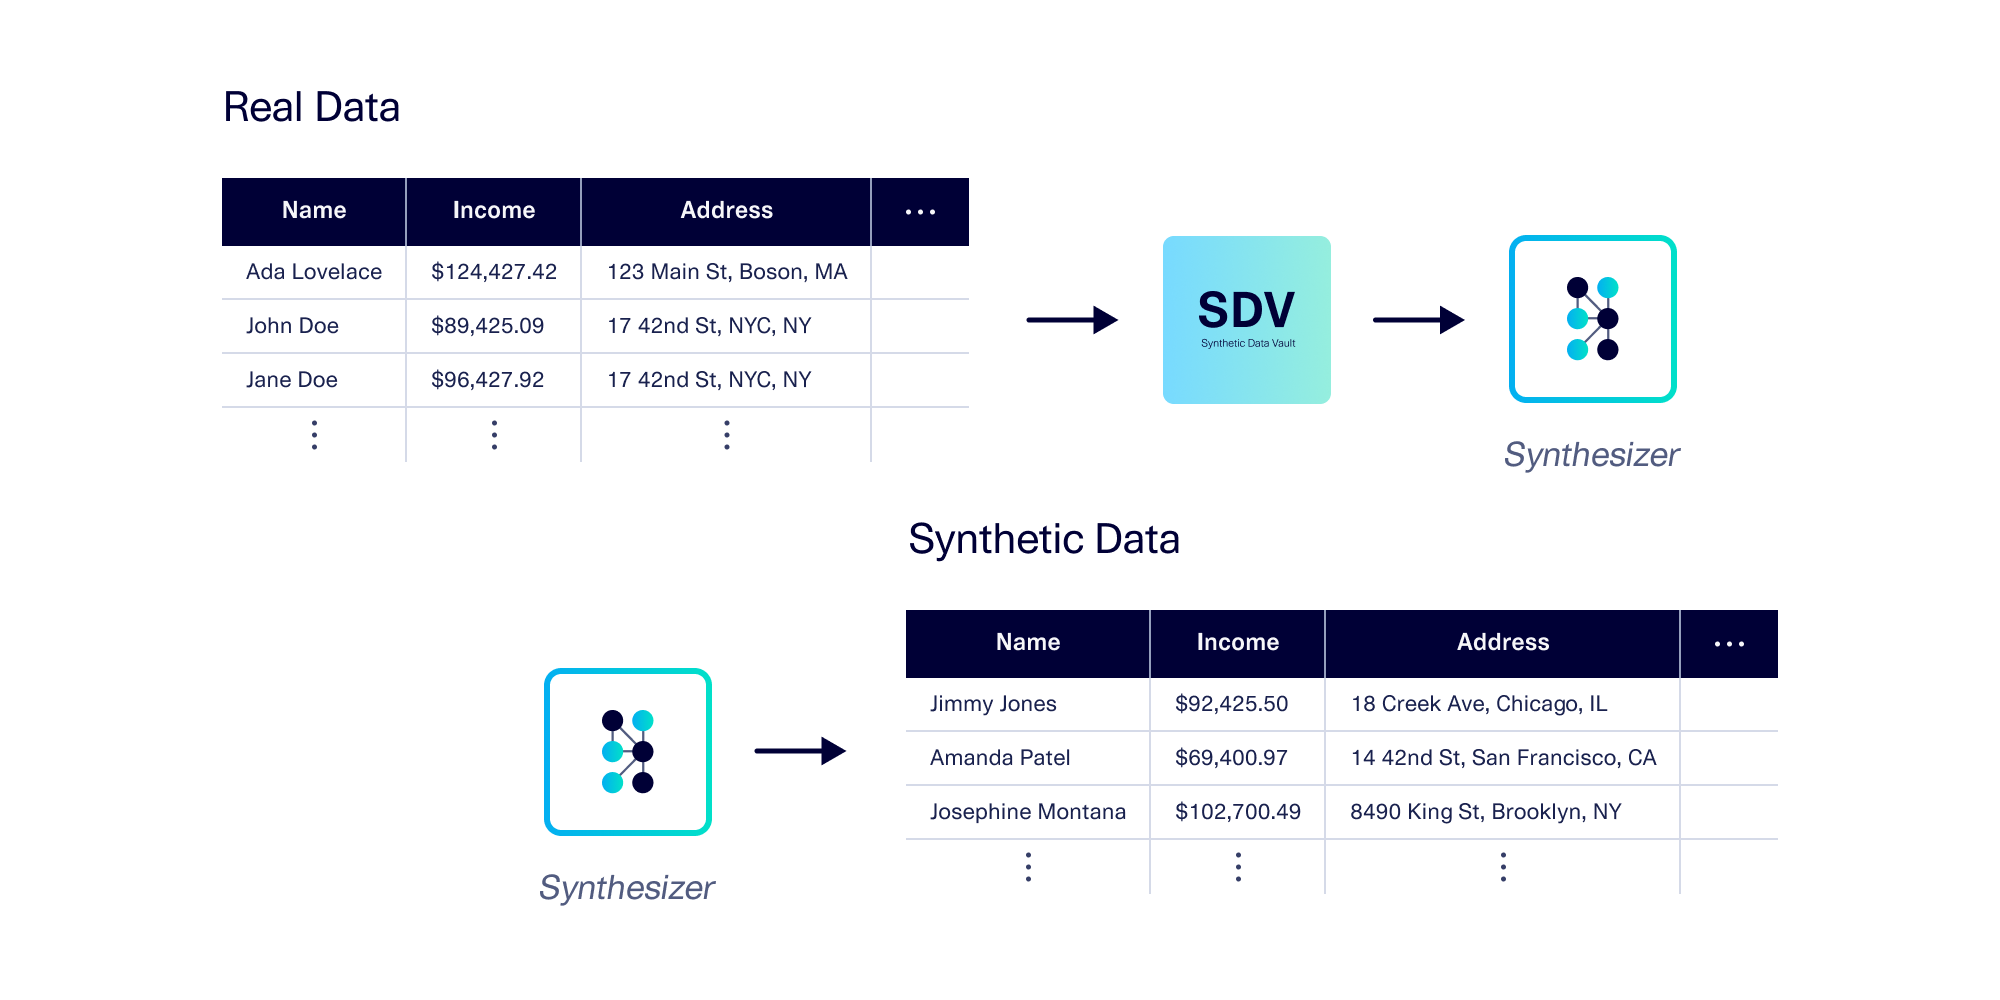
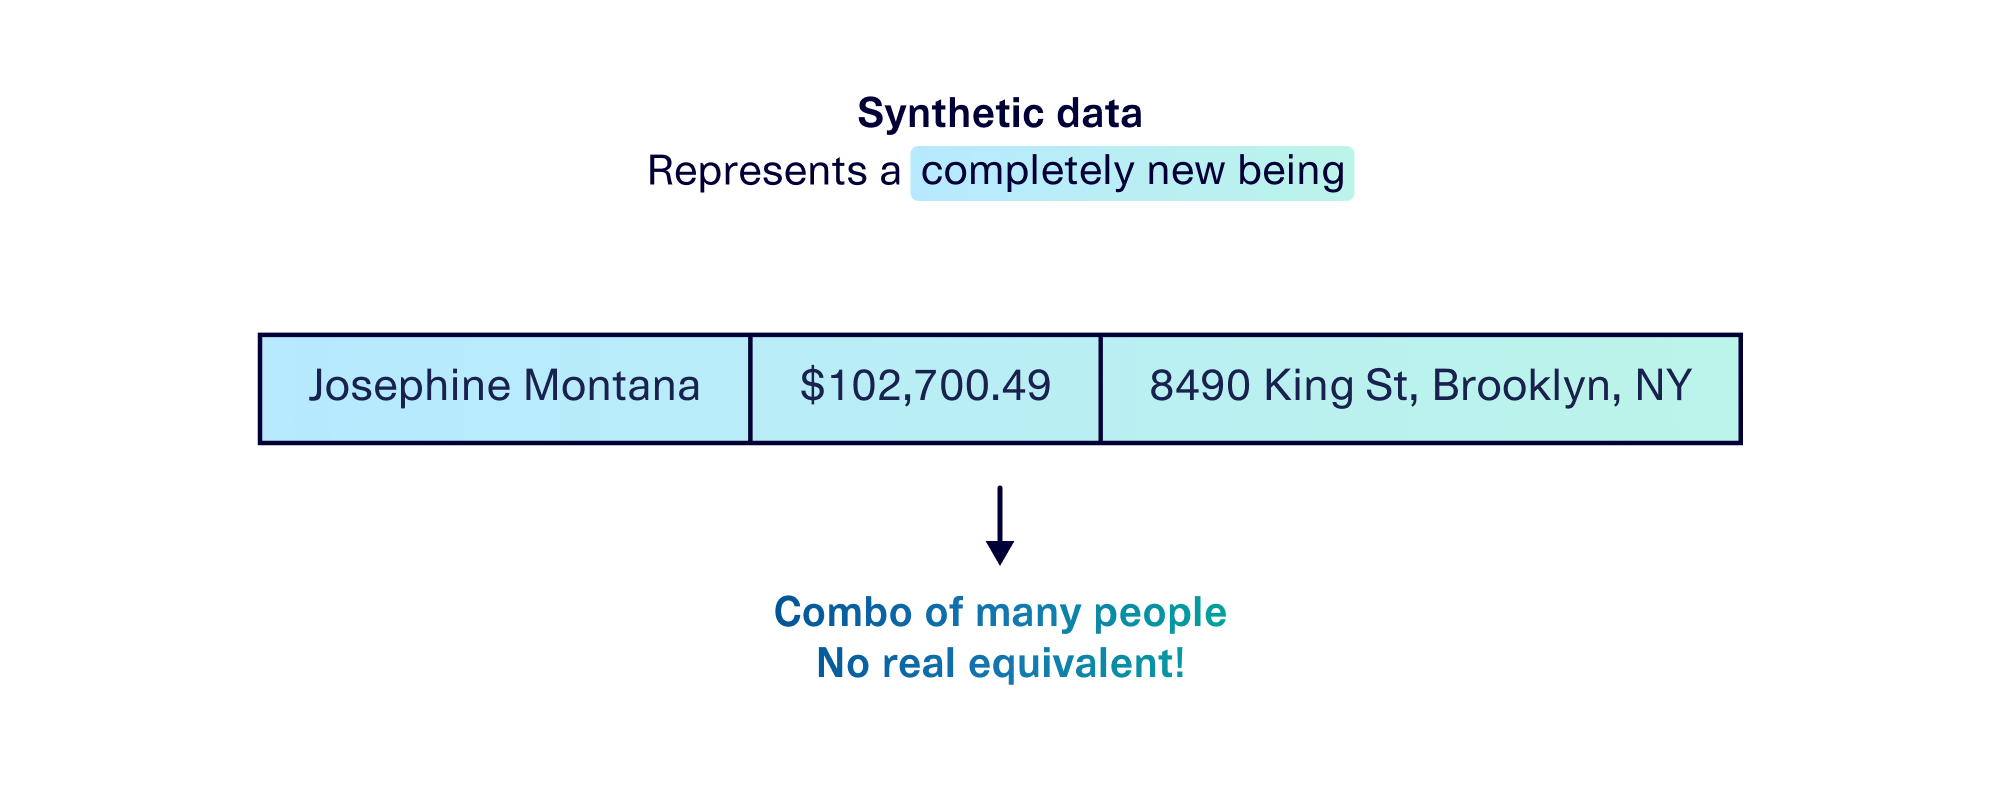
In the census example, the real data reflects information about real people. But the synthetic data we create is comprised of completely new, never-before-seen individuals that do not actually exist. While a synthetic person may have a mishmash of characteristics from different real people, we cannot point to a single real person and claim that they are the one source for a synthetic person.
As a result, we are freed from the bounds of the real data. We can use our synthesizer to produce new, synthetic data at much higher scales than before, creating a diverse dataset that may be 10x or 100x the size of the original dataset.
How is this possible? It all boils down to the patterns that the synthesizer is using to generate new data. The patterns are essentially statistical properties that allow for some randomness, meaning that the synthetic data can be more granular than the real data, and can contain combinations that did not appear in the real data. Some examples are shown below.
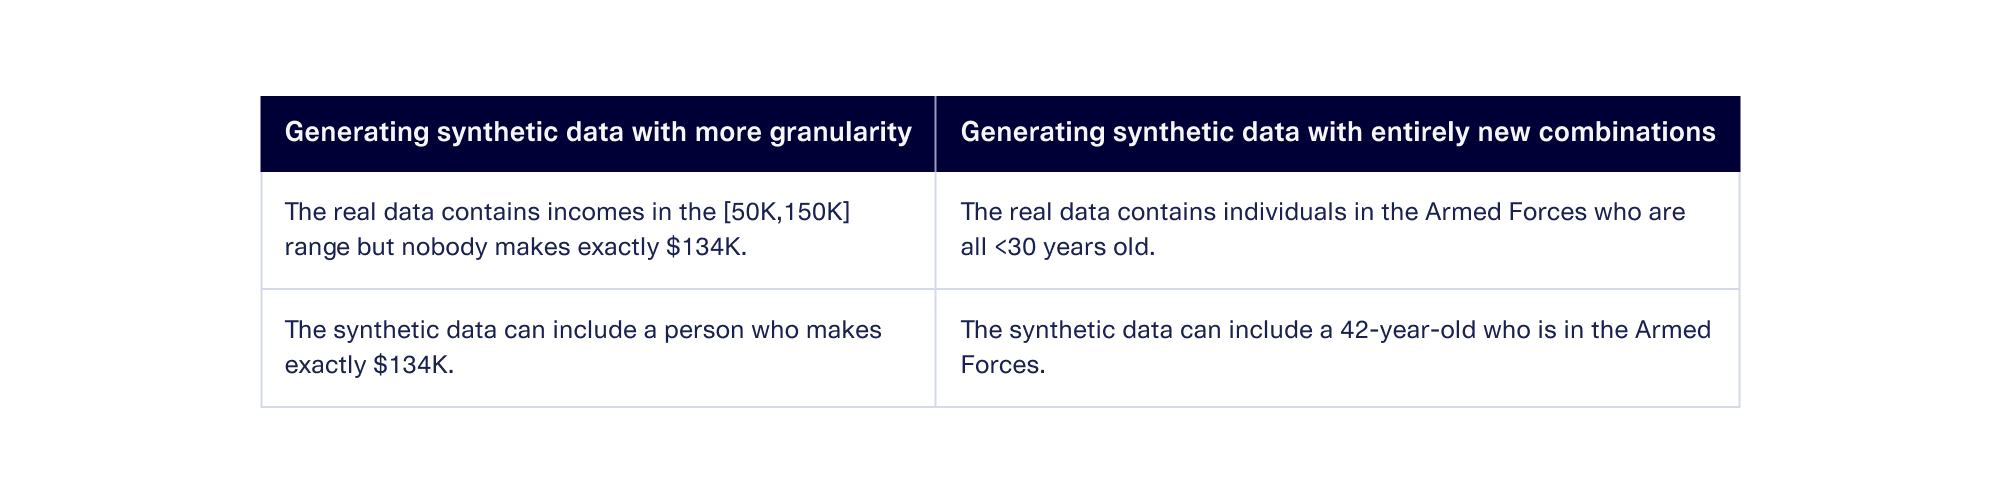
The synthesizer creates new data by combining all the different characteristics that it has seen in the real data – and occasionally venturing to break a pattern or two. In this sense, a synthesizer is a diversification engine: It creates new combinations. This is a good thing: Chances are, the real data doesn't actually capture all possibilities, so why limit yourself?
Measuring data diversity in census data
To see this increased diversity in action, we created synthetic data based on an old census dataset using SDV's GaussianCopulaSynthesizer. The census dataset includes 18 attributes for each person, represented in columns such as "age," "occupation," "race," and "marital-status." The synthetic data contains all of these 18 attributes, generated for entirely new people.
To estimate diversity, we chose 2 columns that we're particularly interested in – age and occupation. We measured the number of unique combinations of age and occupation in the synthetic data, observing how that number changes as we create more and more synthetic data. We expect the number of unique combinations to increase until we hit a maximum threshold. In our case, there is a maximum of 1100 combinations because:
- There are 74 possibilities for age (ranging from 17 through 90) and
- There are 15 possibilities for occupation (the census covers 14 of them, plus a "missing value" category)
The graph below shows how the number of unique combinations rises as we create more synthetic data. As a comparison point, we've also run this test using a random data generator that does not use generative AI.
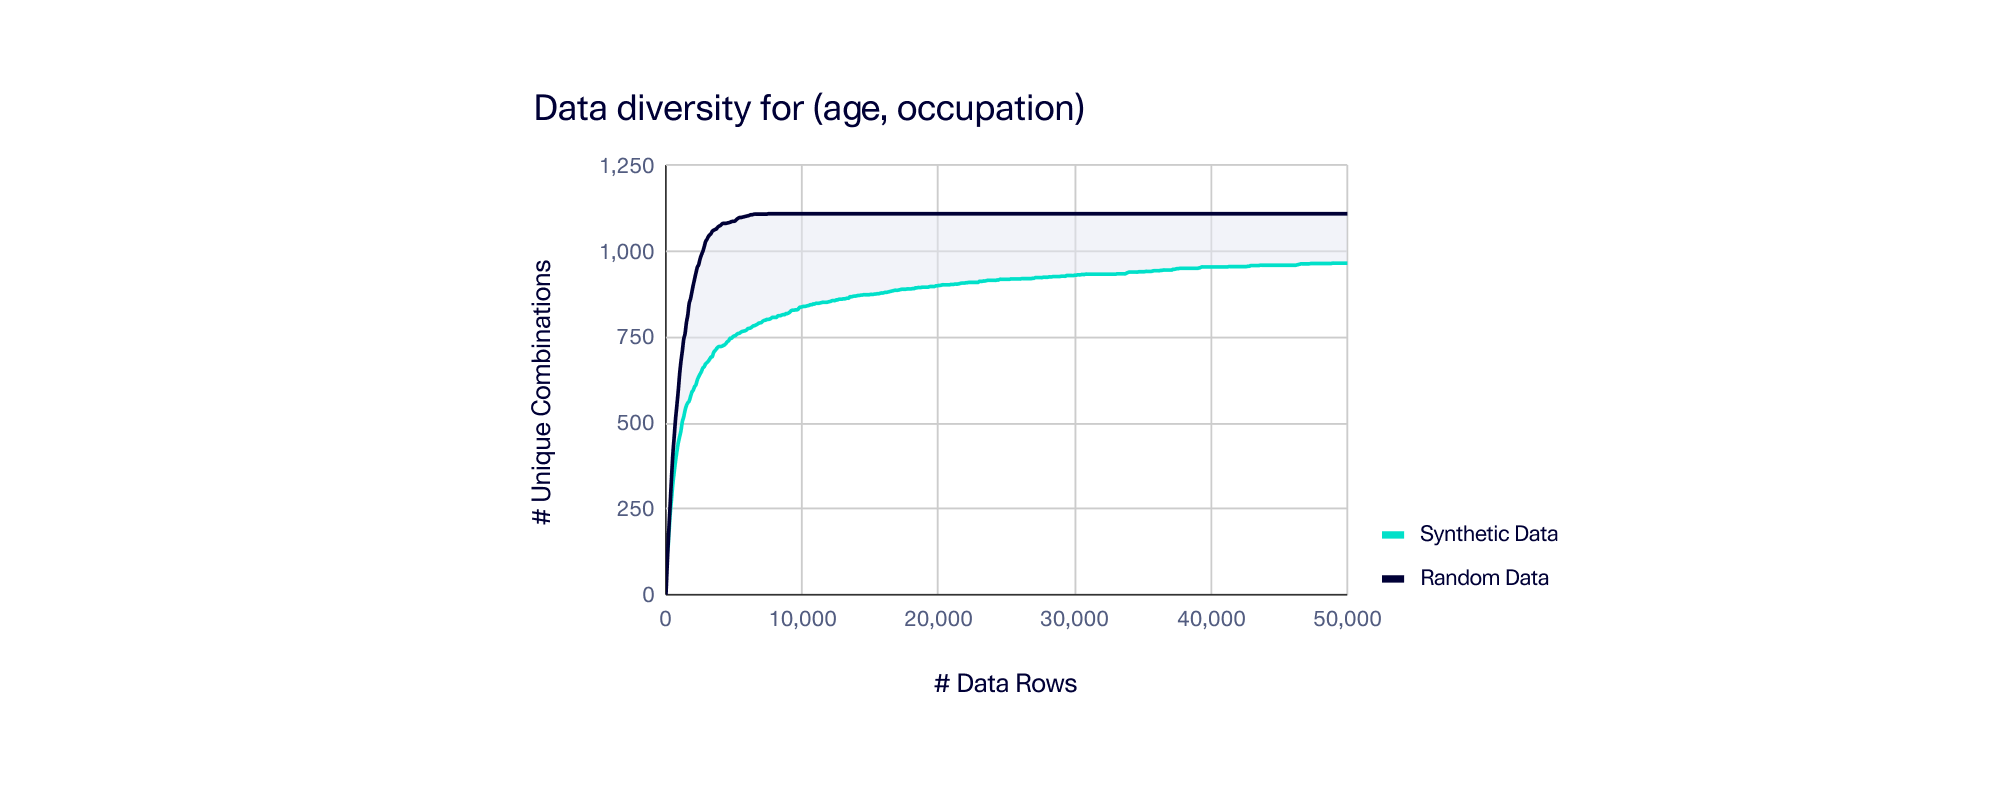
As expected, the random data generator produced a lot of data diversity very quickly. At 7,500 rows, it had already generated all 1,110 possible combinations. (For the math nerds out there, this is essentially the Coupon collector's problem. This formula predicts we'd need an average of 8,400 random rows to collect all combinations, and our results were in that ballpark.)
On the other hand, the synthetic data lagged behind the random generator, because it is using a generative AI to consider the overall data patterns. The shaded area between the random data and synthetic data curves indicates the combinations we missed out on due to this AI.
Still, it wasn't too far behind. Below is a table showing the # of unique combinations at a few critical points – first at 5K rows, which corresponds to the bend of the curve in random data; then at 25K, where the synthetic data curve is flattening out, and finally at 50K, which is the maximum number of rows we created.
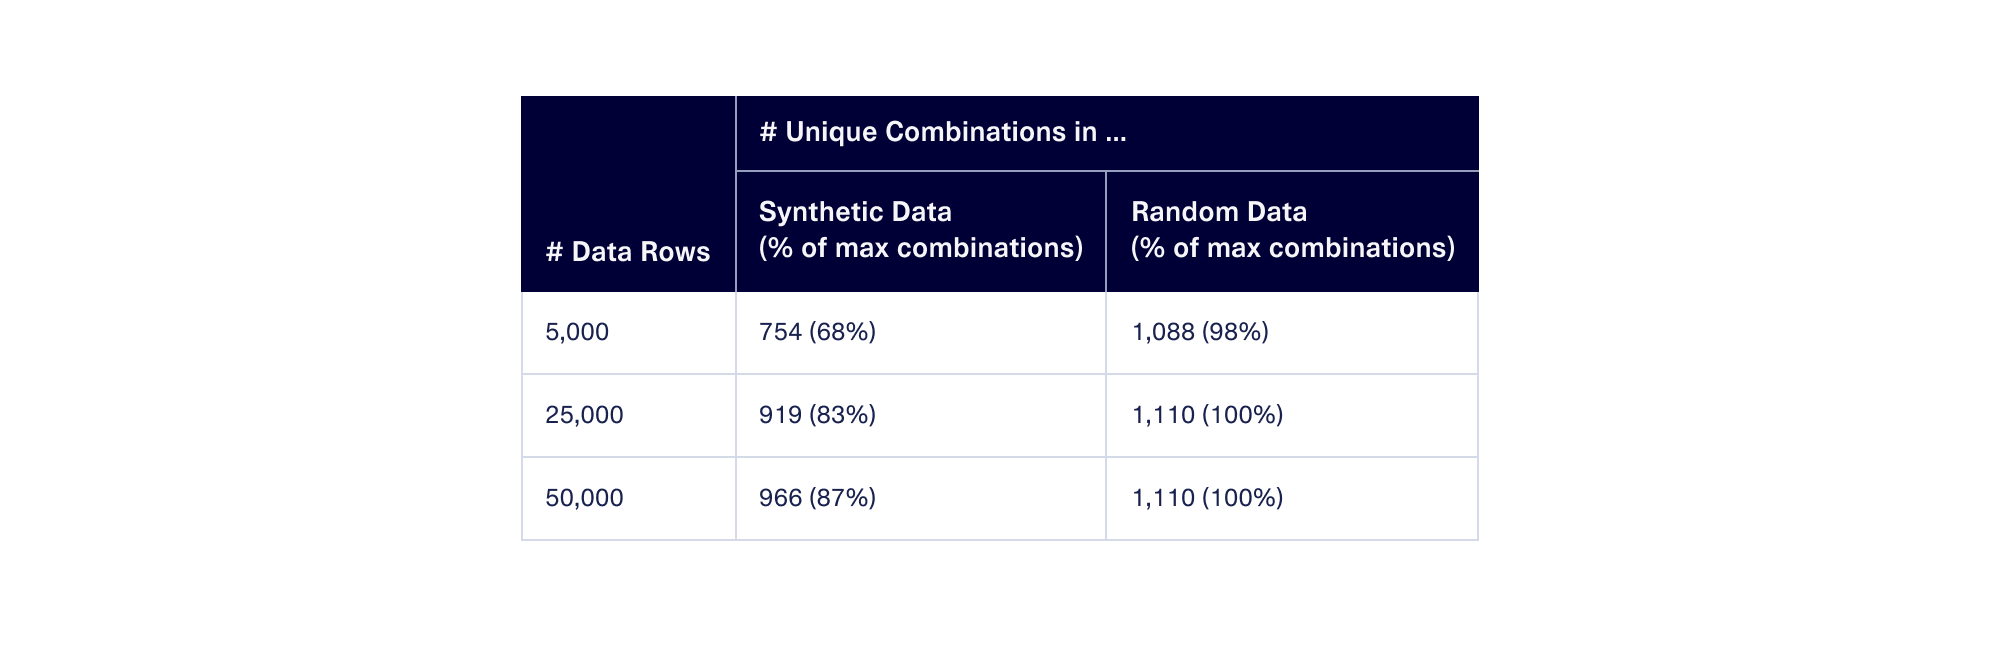
As a result of this, we can conclude that the diversity of data produced by this synthesizer is fairly competitive with that of random data.
This is even more impressive considering that a synthesizer also emulates real data patterns – something that the random data does not do at all. Next, we'll discuss how it does this, and why diversity plus quality is the key to success.
Diverse synthetic data can also be high-quality
A synthesizer can create so many different combinations of data that our users sometimes wonder about that data's quality. They ask: Can diverse synthetic data ever be realistic? Our answer is an emphatic yes – as long as we're clear about what we're measuring.
The metric of data quality measures whether the synthetic data has the same patterns as the real data. Meanwhile, data diversity captures the overall uniqueness of the data that we generate. These two traits can exist at the same time — a dataset can have both high data quality and high data diversity. To showcase this, let's take a look at the quality of the synthetic dataset we made above.
Quality measure #1: Single column shapes. One measure of quality is the overall shape (or distribution) of each column. We visualize the column shape using either a smooth distribution plot or a bar plot depending on how much synthetic data we generated (5K, 25K and all 50K rows). The resulting graphs are shown below.
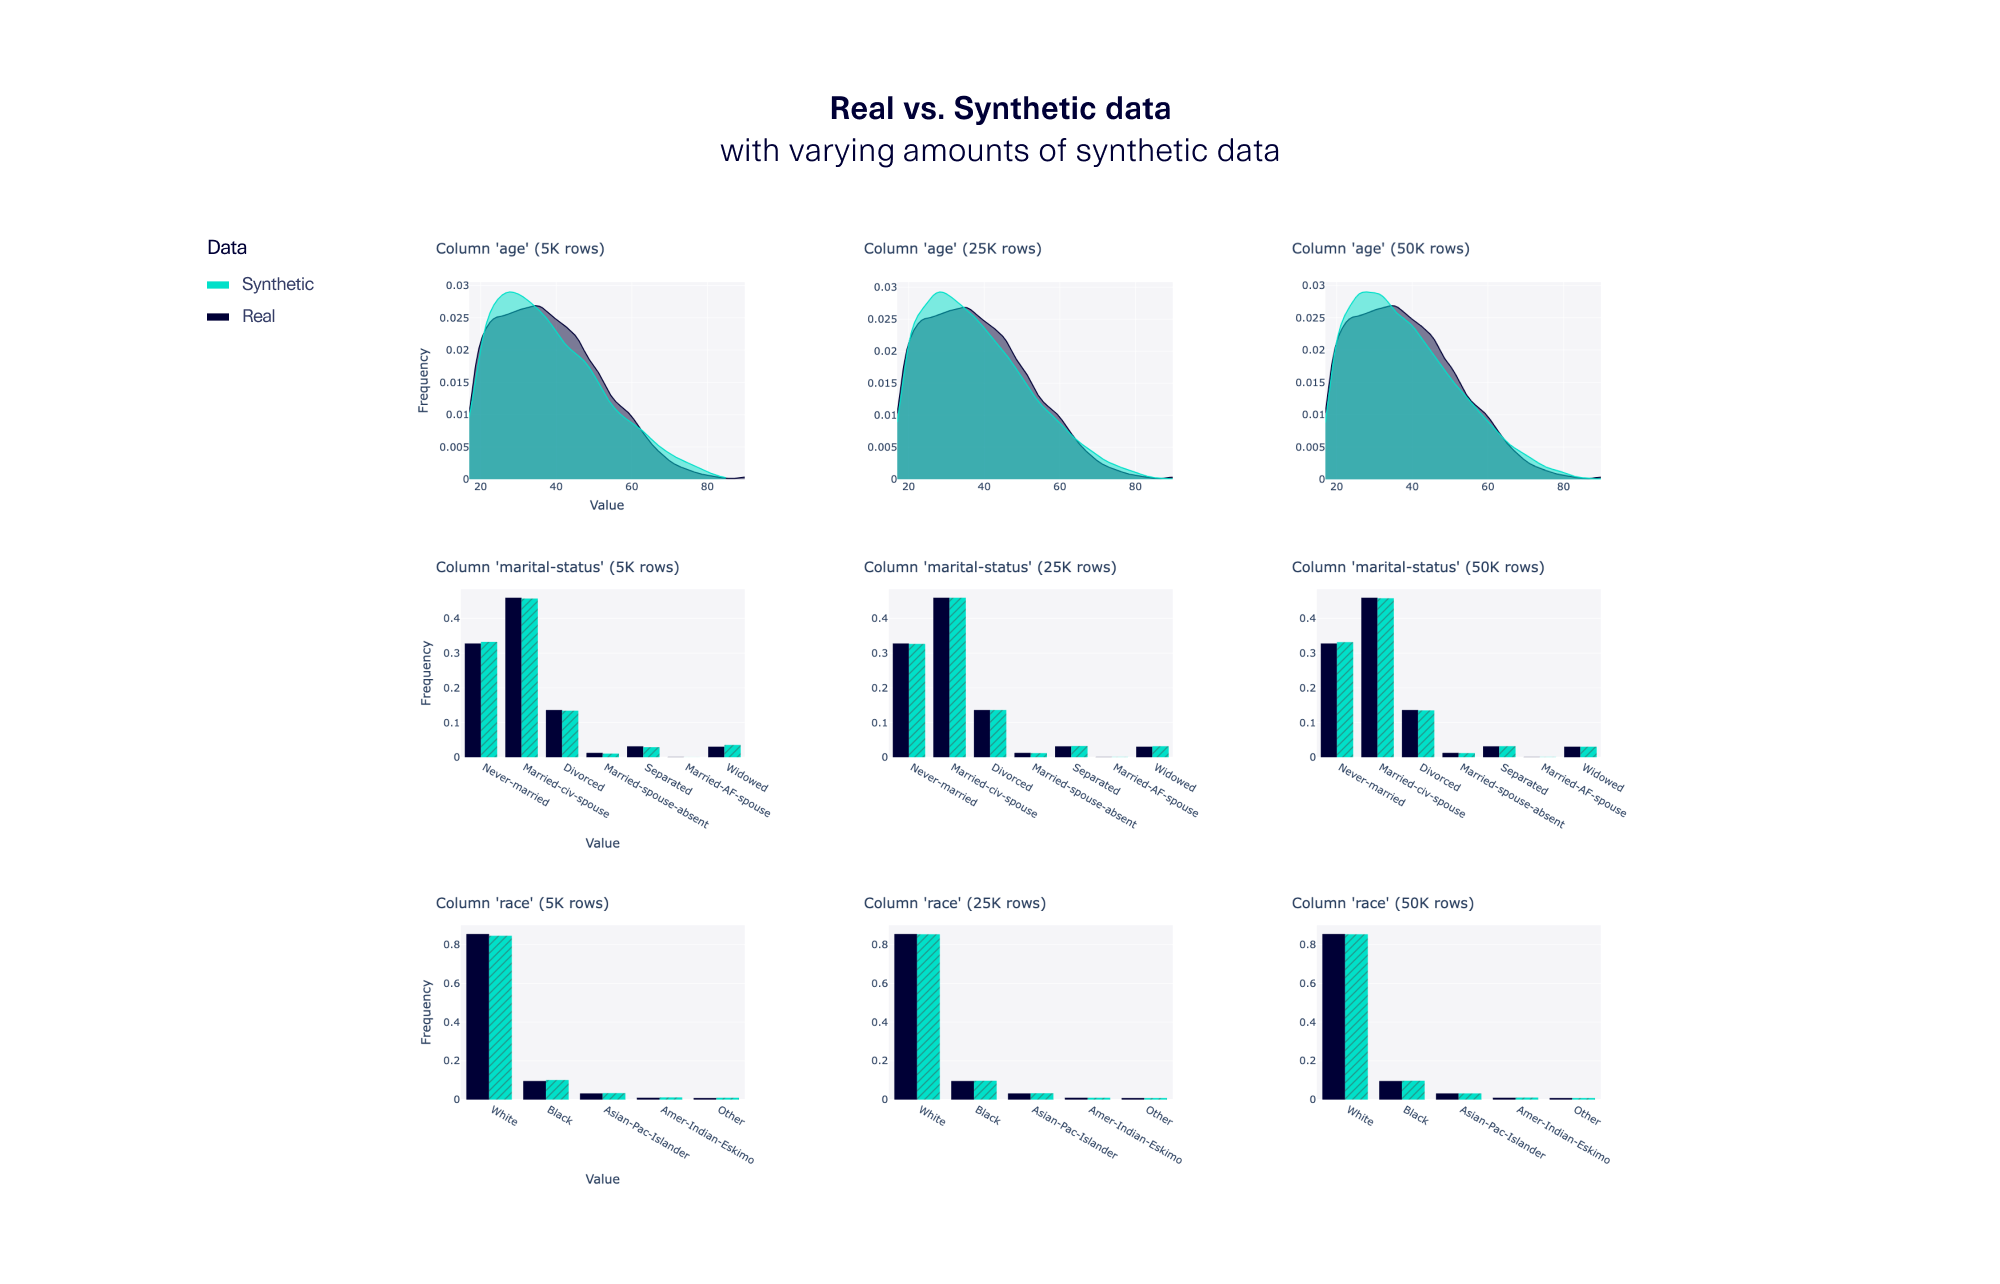
Our results show that for a variety of columns, including age, marital status, and race, the synthetic data highly resembles the real data. Furthermore, the amount of synthetic data we create does not affect the column shape by much. (The minor differences that do appear do so due to random chance.)
This means that even though our synthesizer produces greater data diversity overall, it always maintains the correct proportions of values within each column.
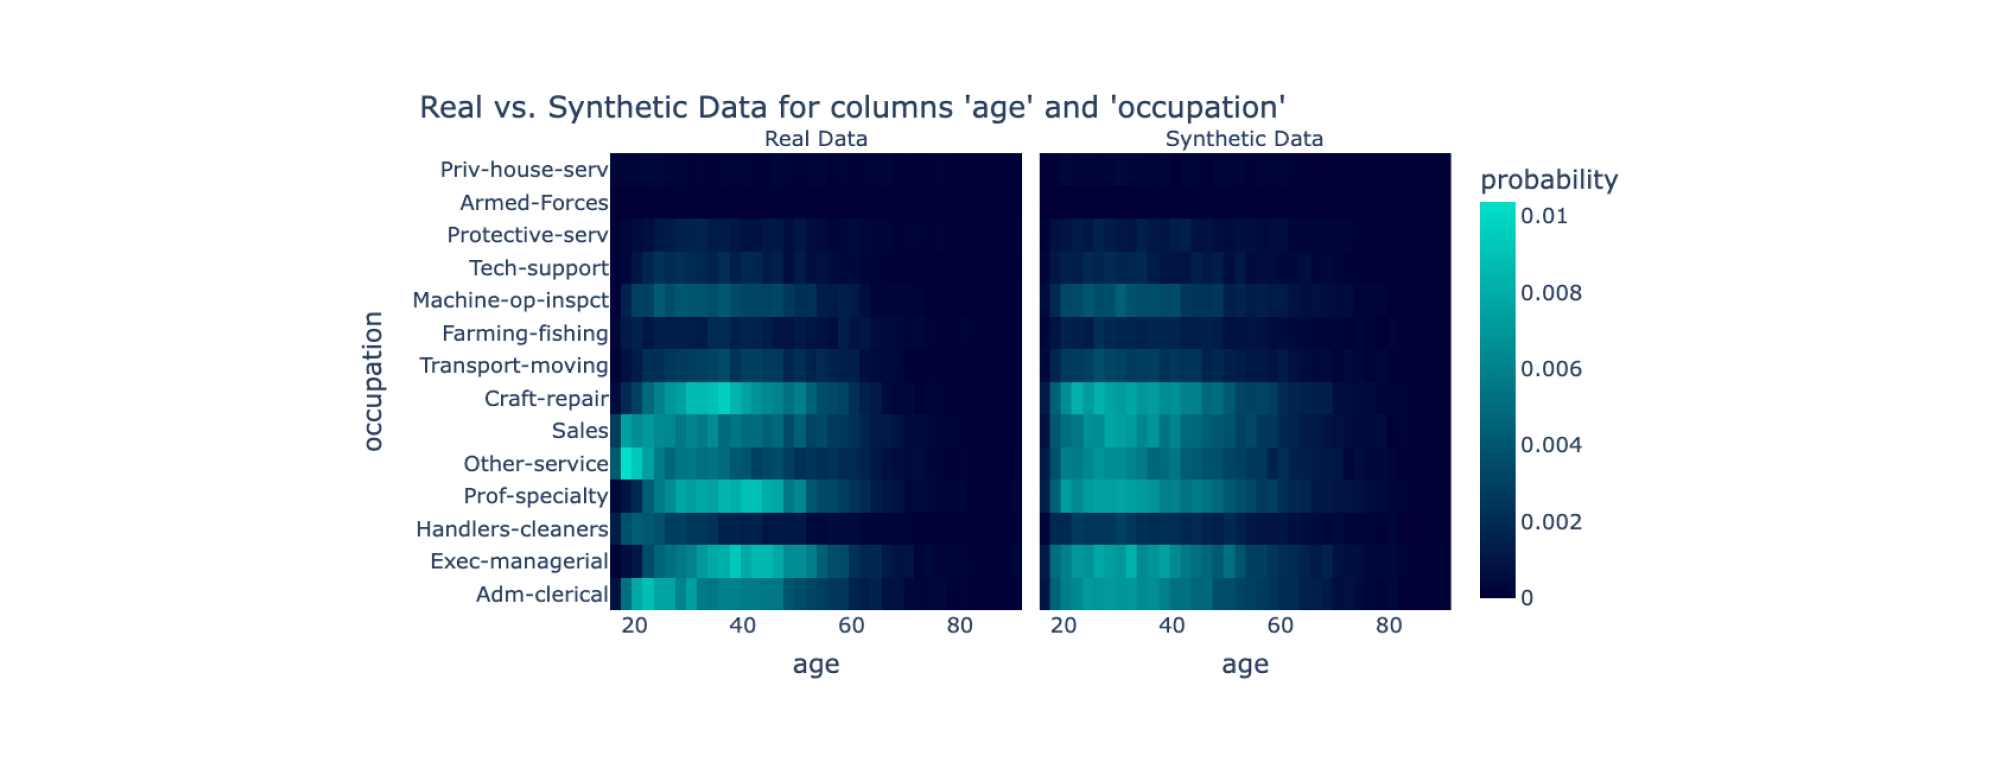
Quality measure #2: Correlations between columns. Another measure of quality is the degree of correlation or trend between multiple columns. At first glance, we may expect that having a higher data diversity would affect the degree of correlation, because the synthetic data contains new permutations (e.g. new age and occupation combinations). However, as long as a majority of the synthetic data captures the trend, we find that these extra permutations do not affect the overall quality by much.
An example is shown below, where we capture a trend between a person's age and their reported occupation. Any new permutations in the synthetic data do not affect the overall trend by much, because they are infrequent. The data continues to favor specific occupations for people of different ages.
While random data has high data diversity, it does not have high data quality. The graphs we've produced for single column shapes and heatmaps would not look nearly as realistic with random data. The benefit of using synthetic data is that it has both helpful traits: high data diversity and high data quality.
Beware of metrics that discourage data diversity
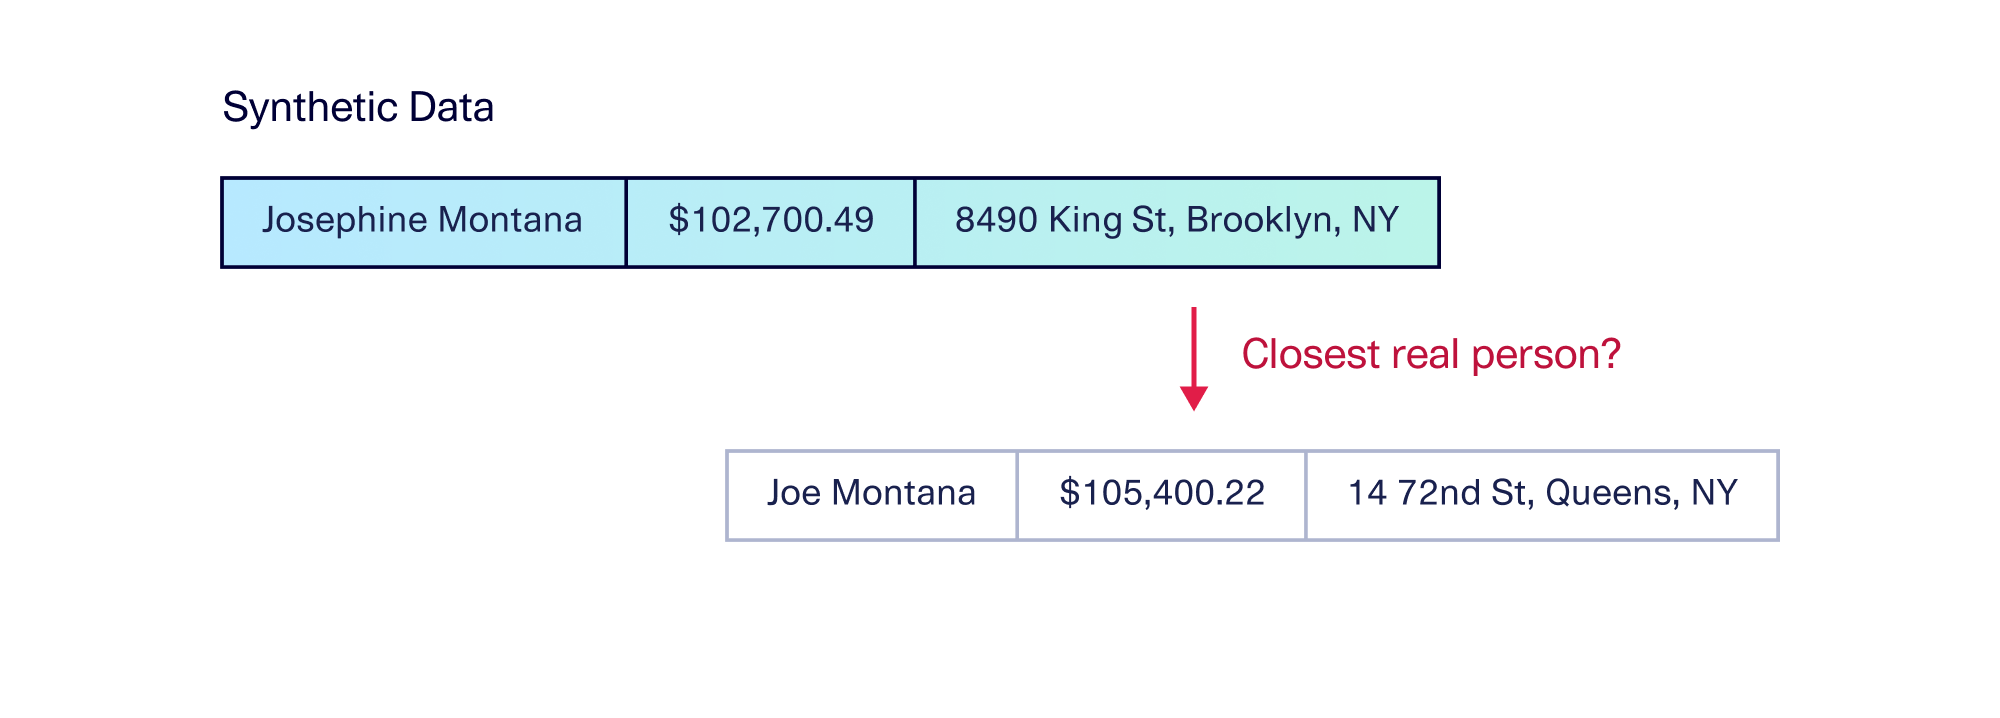
We encourage our users to ensure that their data quality measures are positive, and reinforce the concept of diversity. One particular evaluation to be aware of is a proximity match, such as distance to the nearest neighbor. This measures how close synthetic data points are to a real data point. Such measures consider synthetic data to be higher quality if the datapoints have closer analogues, and penalize larger deviations.
These evaluations can be useful in situations where you want synthetic data to be extremely close to the real data – but they don't take data diversity into account at all. In fact, they penalize the attributes that go along with diverse synthetic data.
In general, we caution our users to beware of evaluations and tools that discourage data diversity. Datasets that do well in these evaluations often have decreased privacy as well as diversity. We also believe that these evaluations go against synthetic data's real purpose — creating brand new data combinations that are useful without necessarily having clear analogues to real data.
You can create synthetic data for multiple types of data
So far, we've worked with a single-table example of synthetic data. We've shown how we can increase data diversity by creating new rows of synthetic data that represent entirely new people. In this section, we'll show how the same concept of data diversity can apply to a variety of data structures. Let's take a look at some examples.
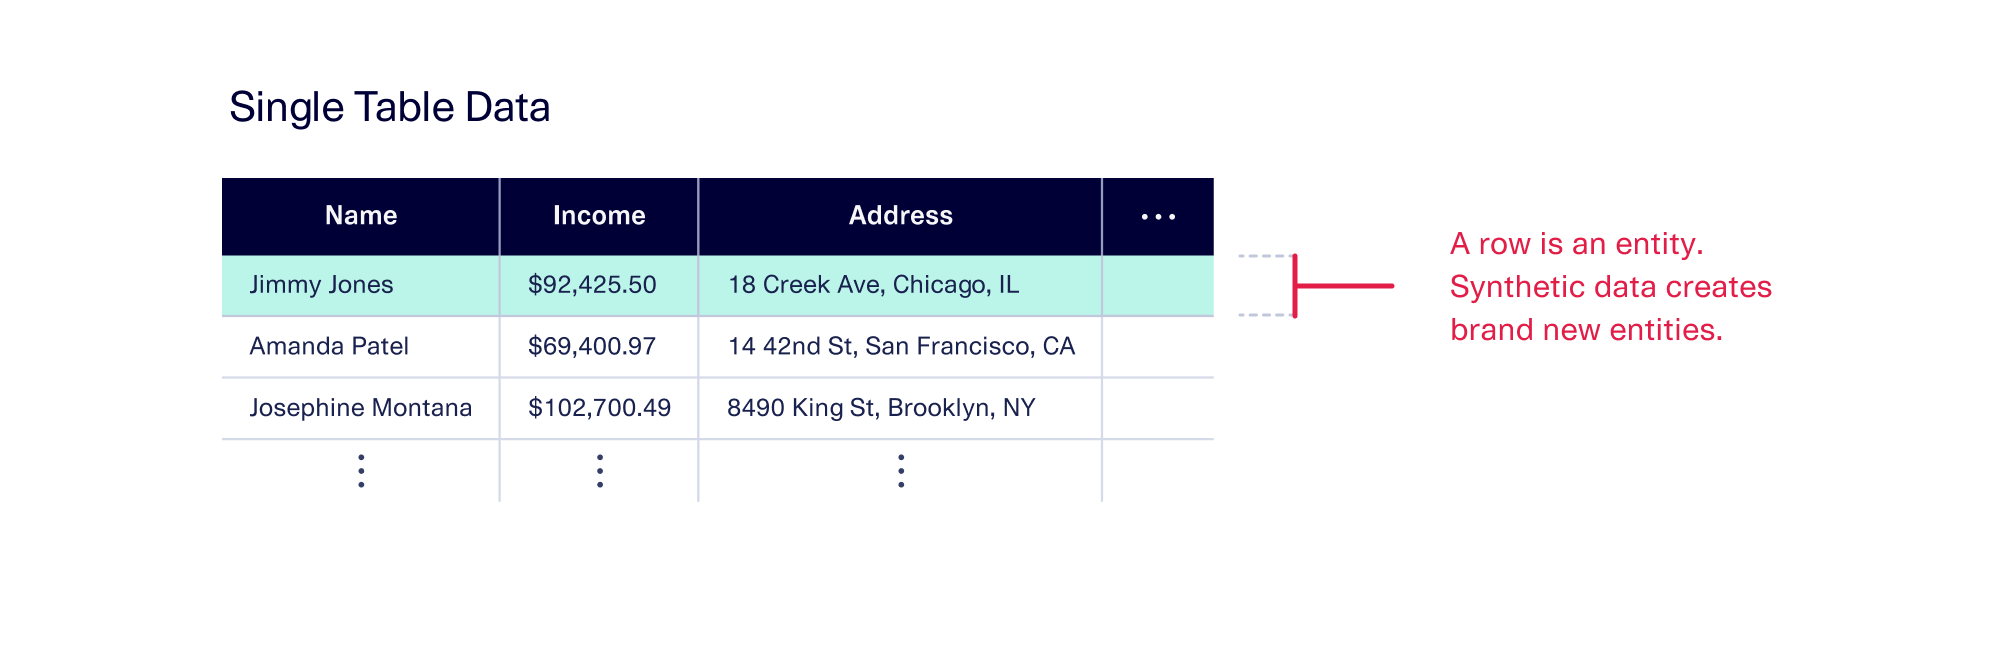
Single-table data: Each row represents a new entity
To recap, our census data is a single-table dataset. In single-table data, we have a 2D grid with rows and columns. Each row typically represents a new entity, and each column represents a new attribute pertaining to that entity. When we create synthetic data, we create brand new entities, meaning new rows that represent completely different people.
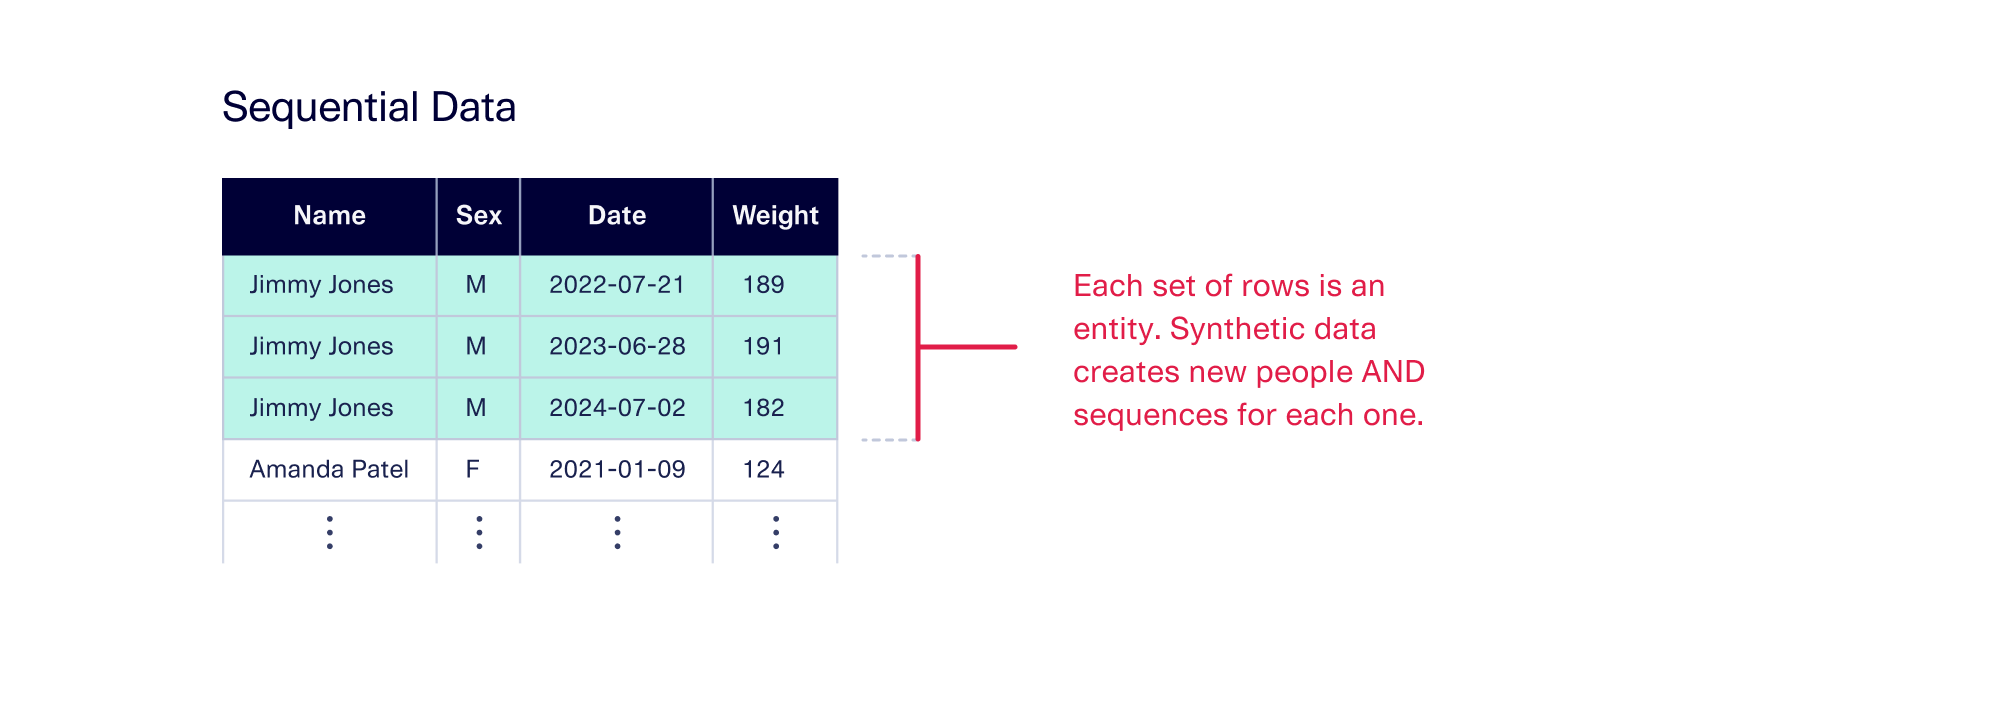
Sequential data: A set of rows represents a new entity
Other datasets may be sequential. While this type of data may still include rows and columns, here a set of rows typically forms a sequence. One example might be in healthcare data, which tracks vital measurements for each patient across time. In such a case, a synthesizer creates brand new people and brand new sequences for each of those people. As with single table data, there won't be a single, real analogue for any of those people or sequences.
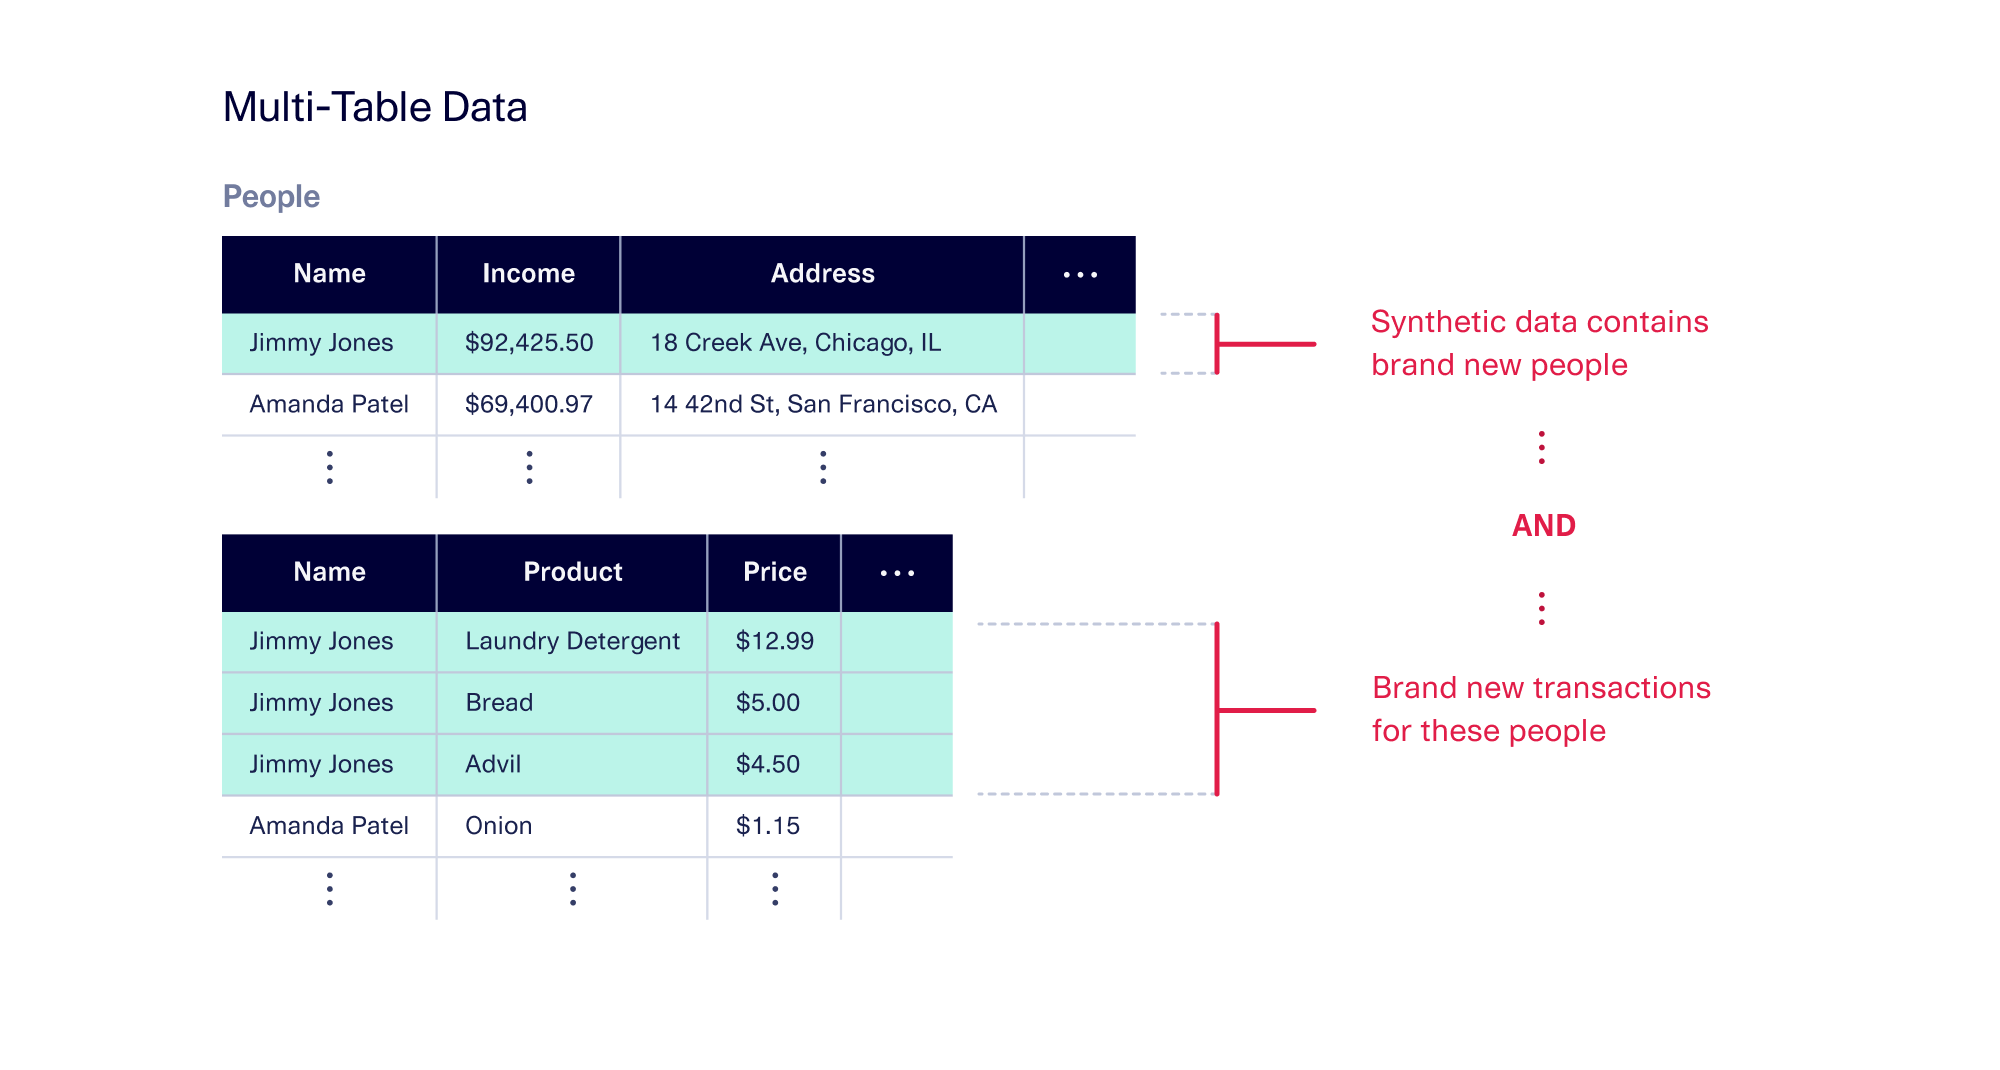
Multi-table data: Every table has its own synthetic data
Finally, in a multi-table setting, different tables are connected to each other via relationships between entities. For example, each person listed in a table of customers may be associated with 1 or more store purchases that are listed in a different table. In this case, each row of each table represents a different entity. The synthesizer creates brand new people in the customer table, and for each person, it creates brand new purchases as well.
In this way, we can see data diversity increasing for all types of data – single-table, sequential, and multi-table.
Feel the power of synthetic data
Many of our users have reported that it is the diversity produced by synthetic data — not the privacy! — that ultimately delivers business value. A key reason for this is that it opens up new possibilities for using the data. For example:
- Synthetic data allows you to create a more robust product. ING creates synthetic financial transactions with 100x the combinations present in their real data. This allows them to thoroughly test all aspects of a complicated payments service, and keep their payments systems working.
- Synthetic data allows you to make better predictions. A research team at UCLA created synthetic credit card fraud events, which combined different characteristics of real fraud events into rarer occurrences. The synthetic data allowed them to better predict future credit card fraud by nearly 20x because it allowed them to proactively identify new types of attacks.
- Synthetic data allows you to navigate new ideas. One promising new direction for research and development teams involves using synthetic data to invent brand new products by combining attributes of existing ones.
In each of these cases, the diversity of synthetic data enables the project to succeed.
Ready to get started with synthetic data? The Synthetic Data Vault is a publicly available Python SDK that you can use to learn from real data and create a diverse synthetic data.