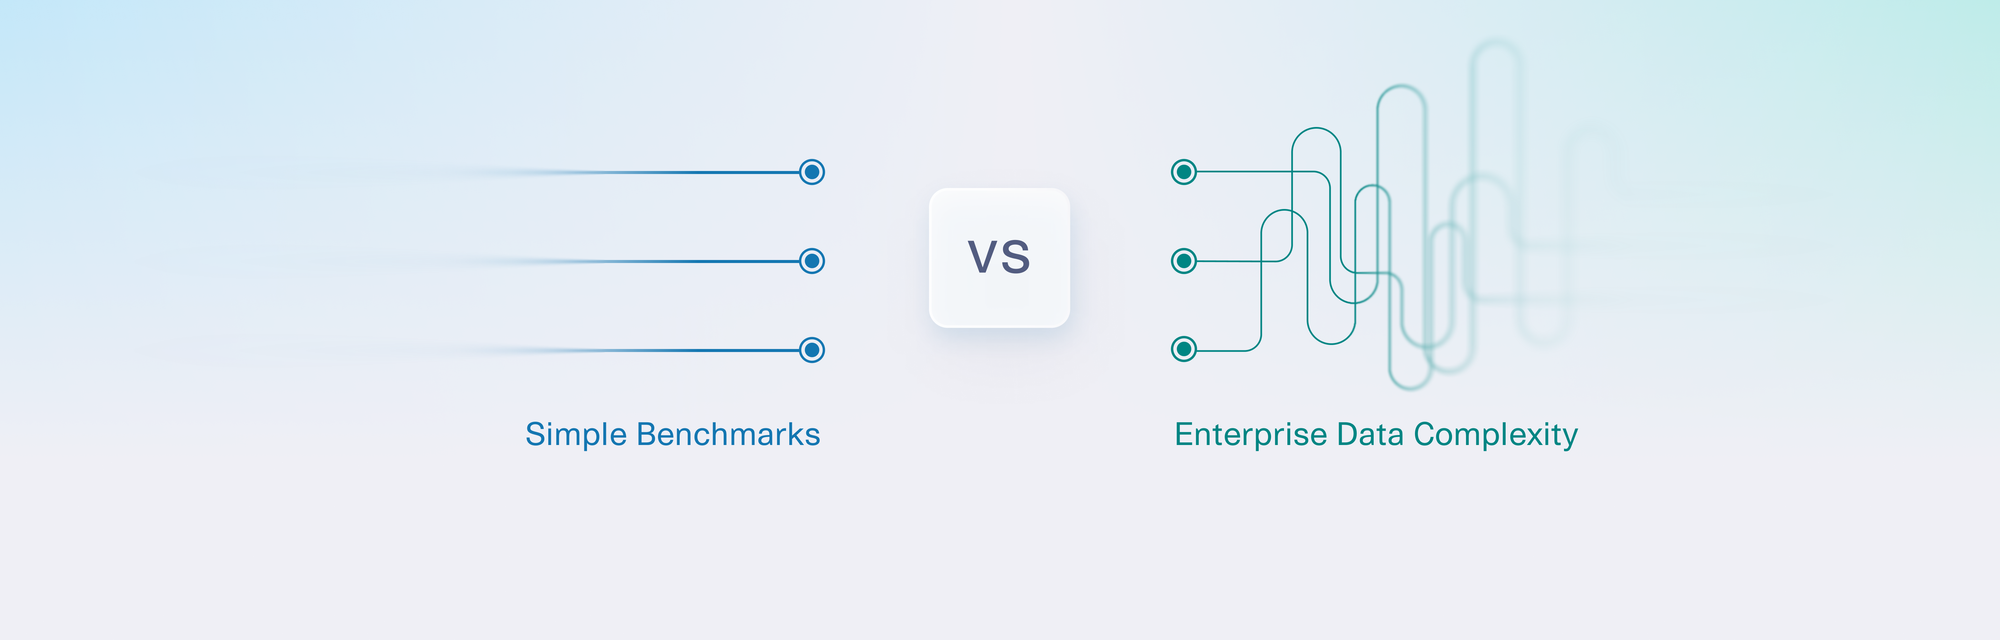
A dataset can unlock many doors for your organization, helping with everything from predictive forecasting to data-driven decision making. But in some situations, you may not have all of the data that you need. A common scenario is having too few data points, which can lead to an imbalance of variables.
In this article, we'll take a closer look at this scenario. We'll recap why this can be a problem for your projects and walk you through some possible solutions. We'll end by explaining why synthetic data might be especially useful for overcoming this challenge.
Why is it a problem to have a data imbalance?
At a basic level, data is a record of events, and a data imbalance happens when some events occur much less frequently than others. For example:
- In healthcare, cancer occurs less frequently than diabetes
- In finance, it's rare to see fraudulent credit card charges
- In local government, it's rare to have a day with a major natural disaster such as a fire
A natural data imbalance isn't inherently a problem, but it can become one if the rare events are important. As an example, let's assume you're working at a hospital that is treating COVID patients. One day a new COVID variant – let's call it Variant X – appears in the population. Since it is so new, it currently occurs very rarely (<2.5% of the time). This leads to a data imbalance for this COVID variant, as illustrated below.
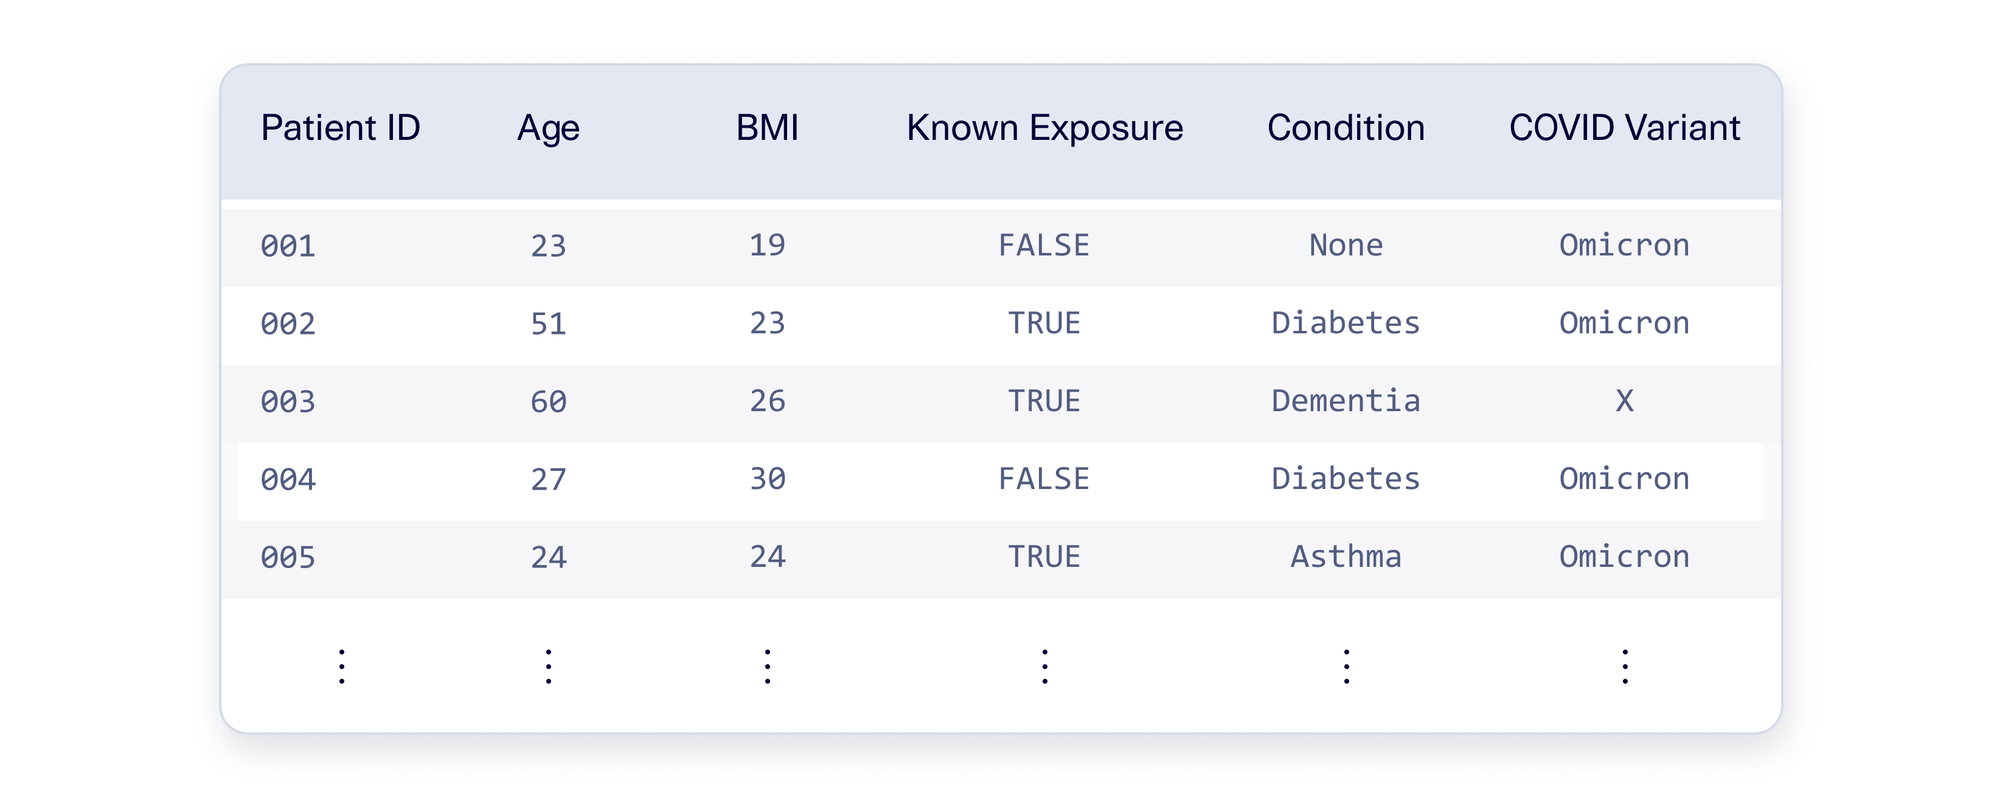
This imbalance is a problem when it's critical to account for Variant X. For example, you may want to build a predictive model for who is most likely to be hospitalized. If you use the data as-is, your model may only consider Omicron (the majority) and treat Variant X as an outlier. This can lead to poor predictions – and bad planning – because Variant X may soon become the dominant strain.
Using Data Augmentation to Fix Imbalances
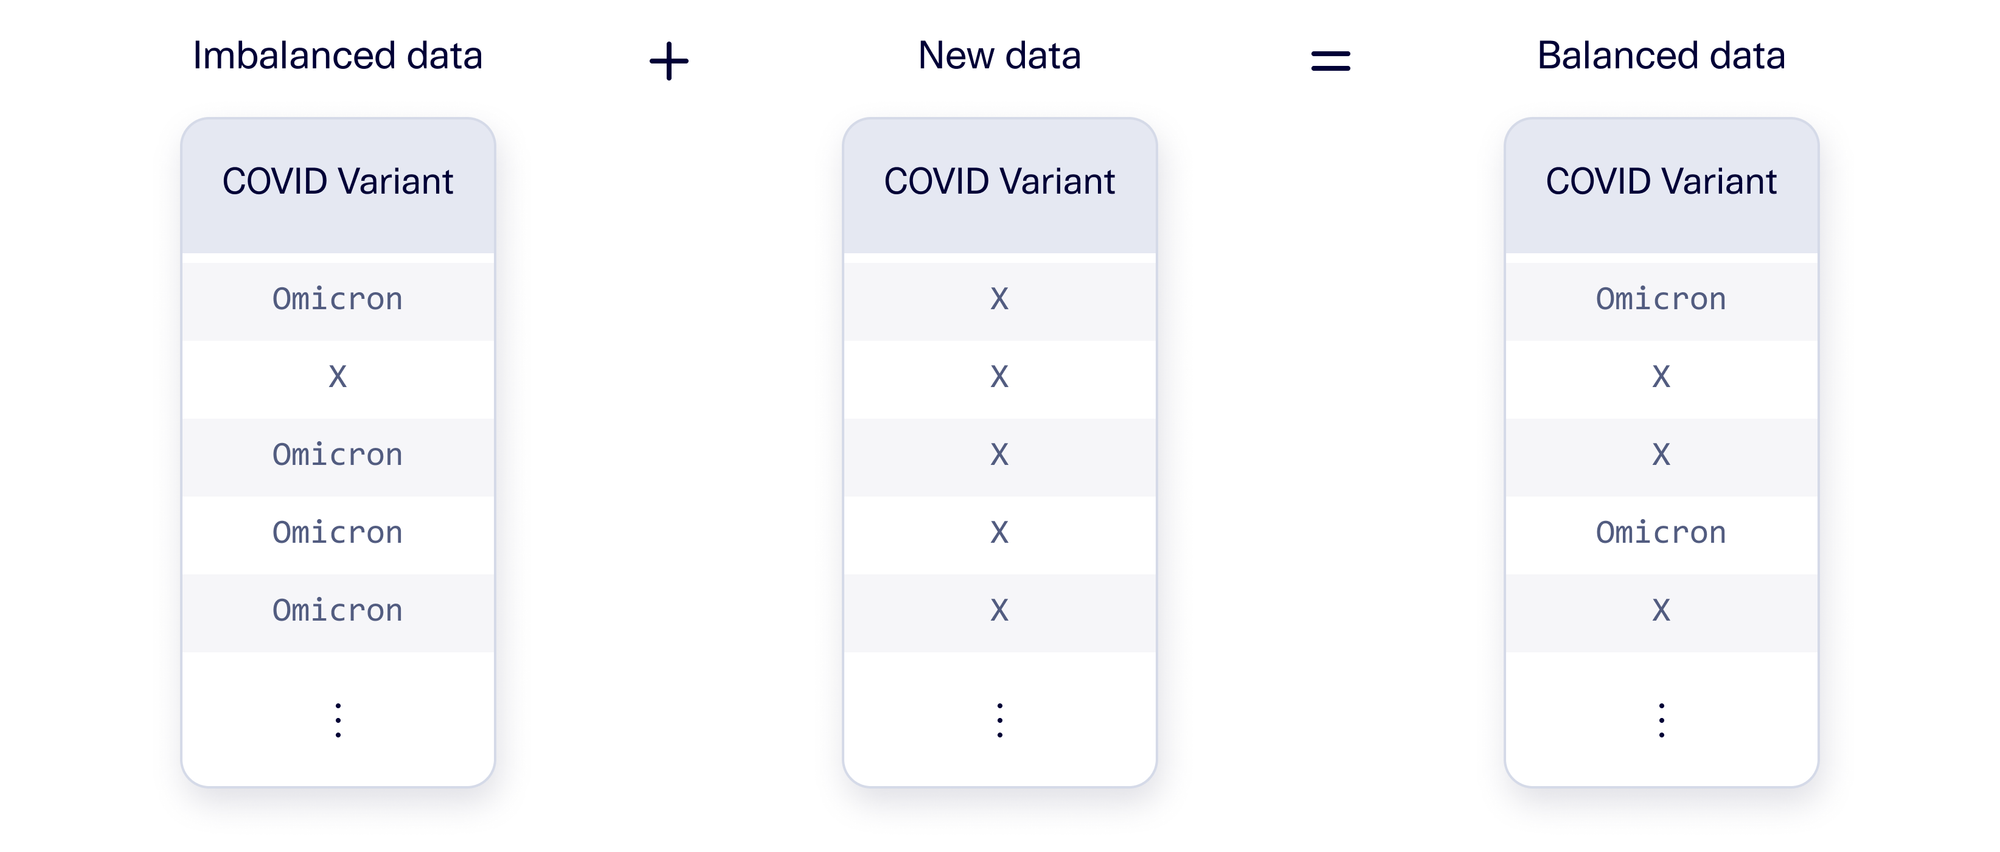
In an ideal world, your data would include more patients with Variant X. But until then, you need to find a solution that will allow you to produce reasonable predictions. What if you create some artificial patient data for the sake of making a robust predictive model?
Let's assume you have data for 1,000 COVID hospital patients, 975 with the Omicron variant and 25 with Variant X. If you can create 950 additional artificial Variant X patients, then you can create an evenly-balanced dataset. This process is illustrated below.
You may be skeptical because there are only 25 patients with Variant X to begin with. How can we reasonably produce 950 more based on that? As usual with data science, the devil is in the details. Let's go through some approaches to see what works.
Attempt #1: Oversampling
Your first instinct may be to take the existing 25 Variant X patients and weigh them more heavily. One easy way to achieve this: You can duplicate each original patient 40 times to get 1,000 patients.
In data science, this is known as oversampling. Sometimes, this is done programmatically, sampling patients (with replacement) as many times as needed. Other times, this can be achieved using mathematical formulas to provide weights. An illustration is shown below.
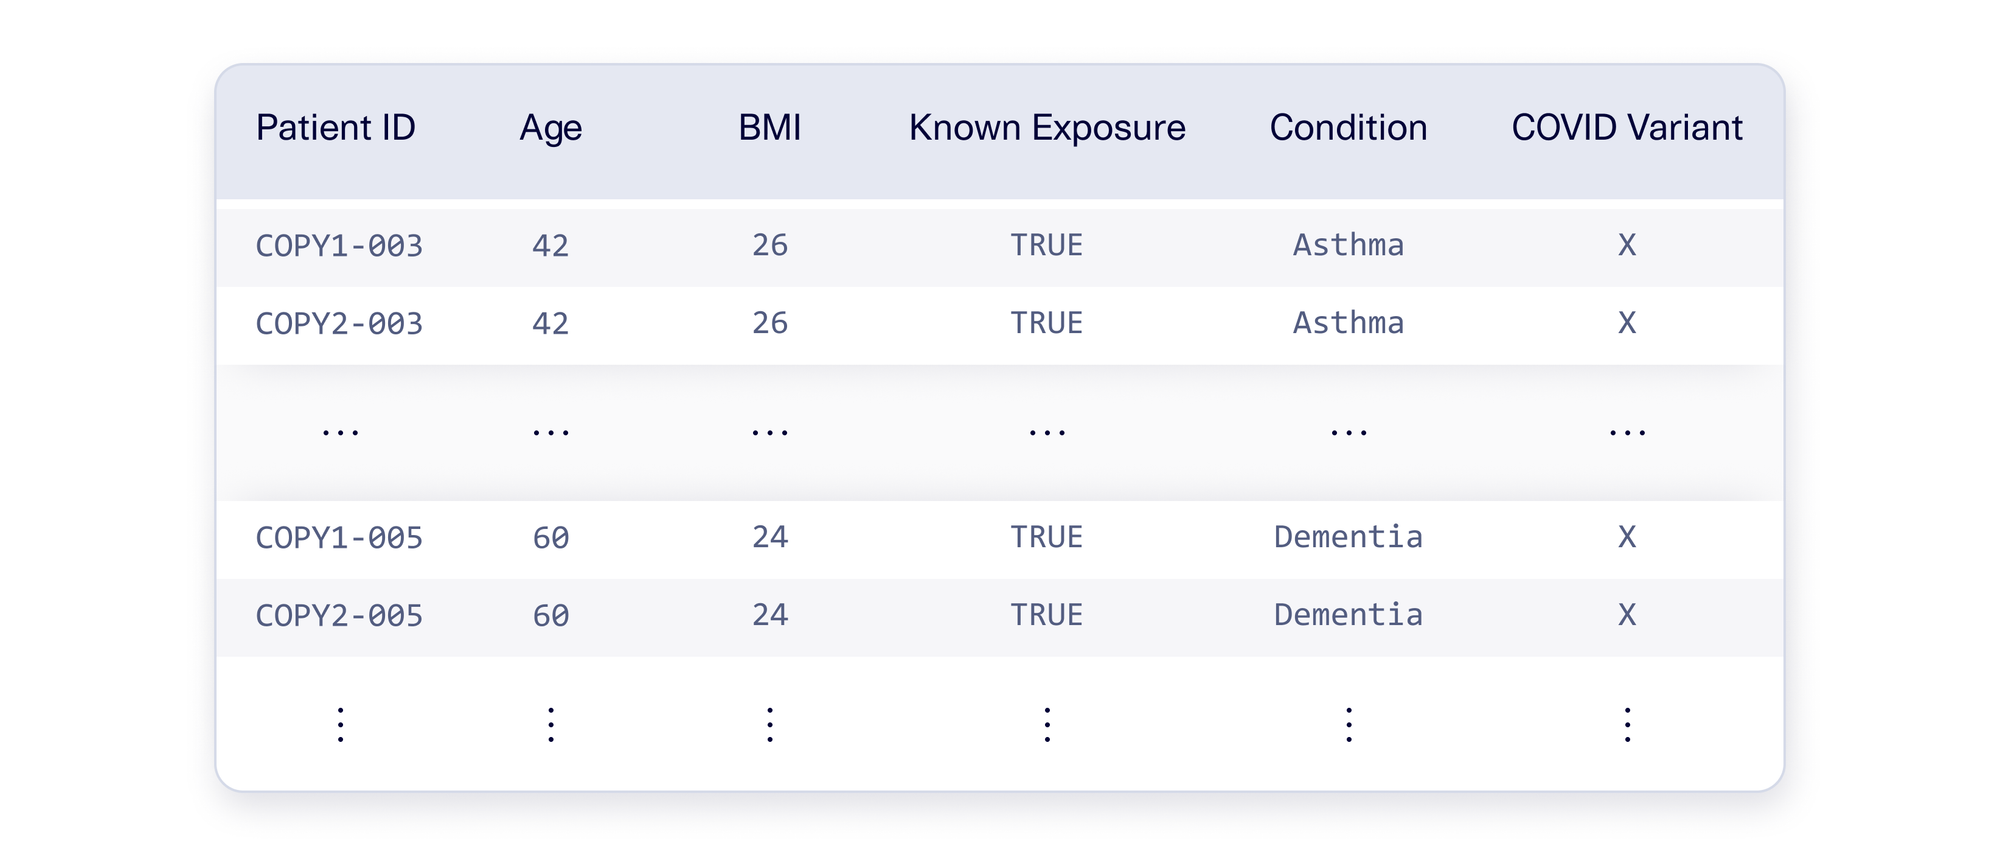
With oversampling, Variant X is no longer rare, so your model cannot ignore it. But if you actually use this data, your project may not be successful. Your model may confidently predict that all Variant X patients must be over the age of 50. But this is not necessarily right – just because the existing patients had these characteristics doesn't mean Variant X patients always will.
The mistake was over-emphasizing the same set of patients, making the model more likely to create strong claims. This is commonly referred to as overfitting the data: The model over-emphasizes the importance of a small number of records, and makes blanket predictions that lack nuance.
Attempt #2: Randomizing
To avoid the problems that come with oversampling, let's explore the opposite direction for argument's sake: What if we created artificial Variant X patients by choosing variables completely at random? An example is illustrated below.
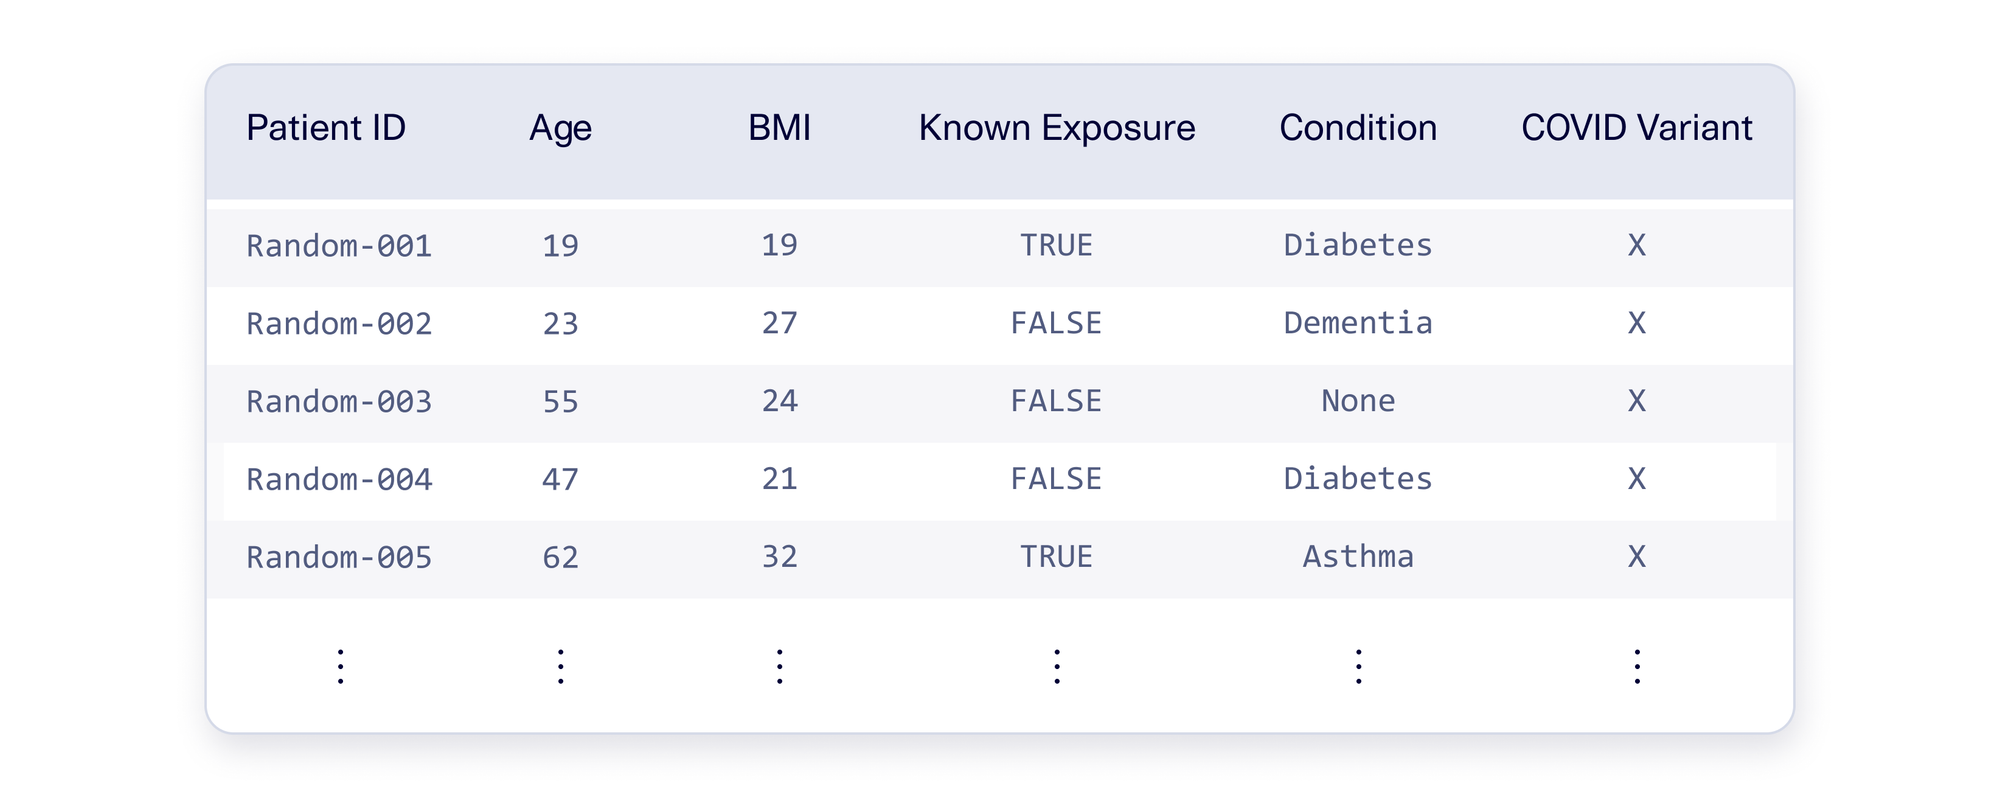
Randomization avoids overfitting because no patient is repeated. But this approach introduces problems of its own: You may find that the data doesn't make sense anymore. The example data above highlights some problems that can arise. We see an artificial 23-year-old patient with dementia, and many diabetic patients with low BMIs. In the medical world, these events are not likely and indicate that there is a problem with the data.
These inconsistencies may (rightfully) dissuade you from using randomization. Since random data lacks patterns, a model will not be able to draw conclusions from it. In data science, we call this a problem of noisiness. Noisy data has too many random combinations to produce any useful learnings.
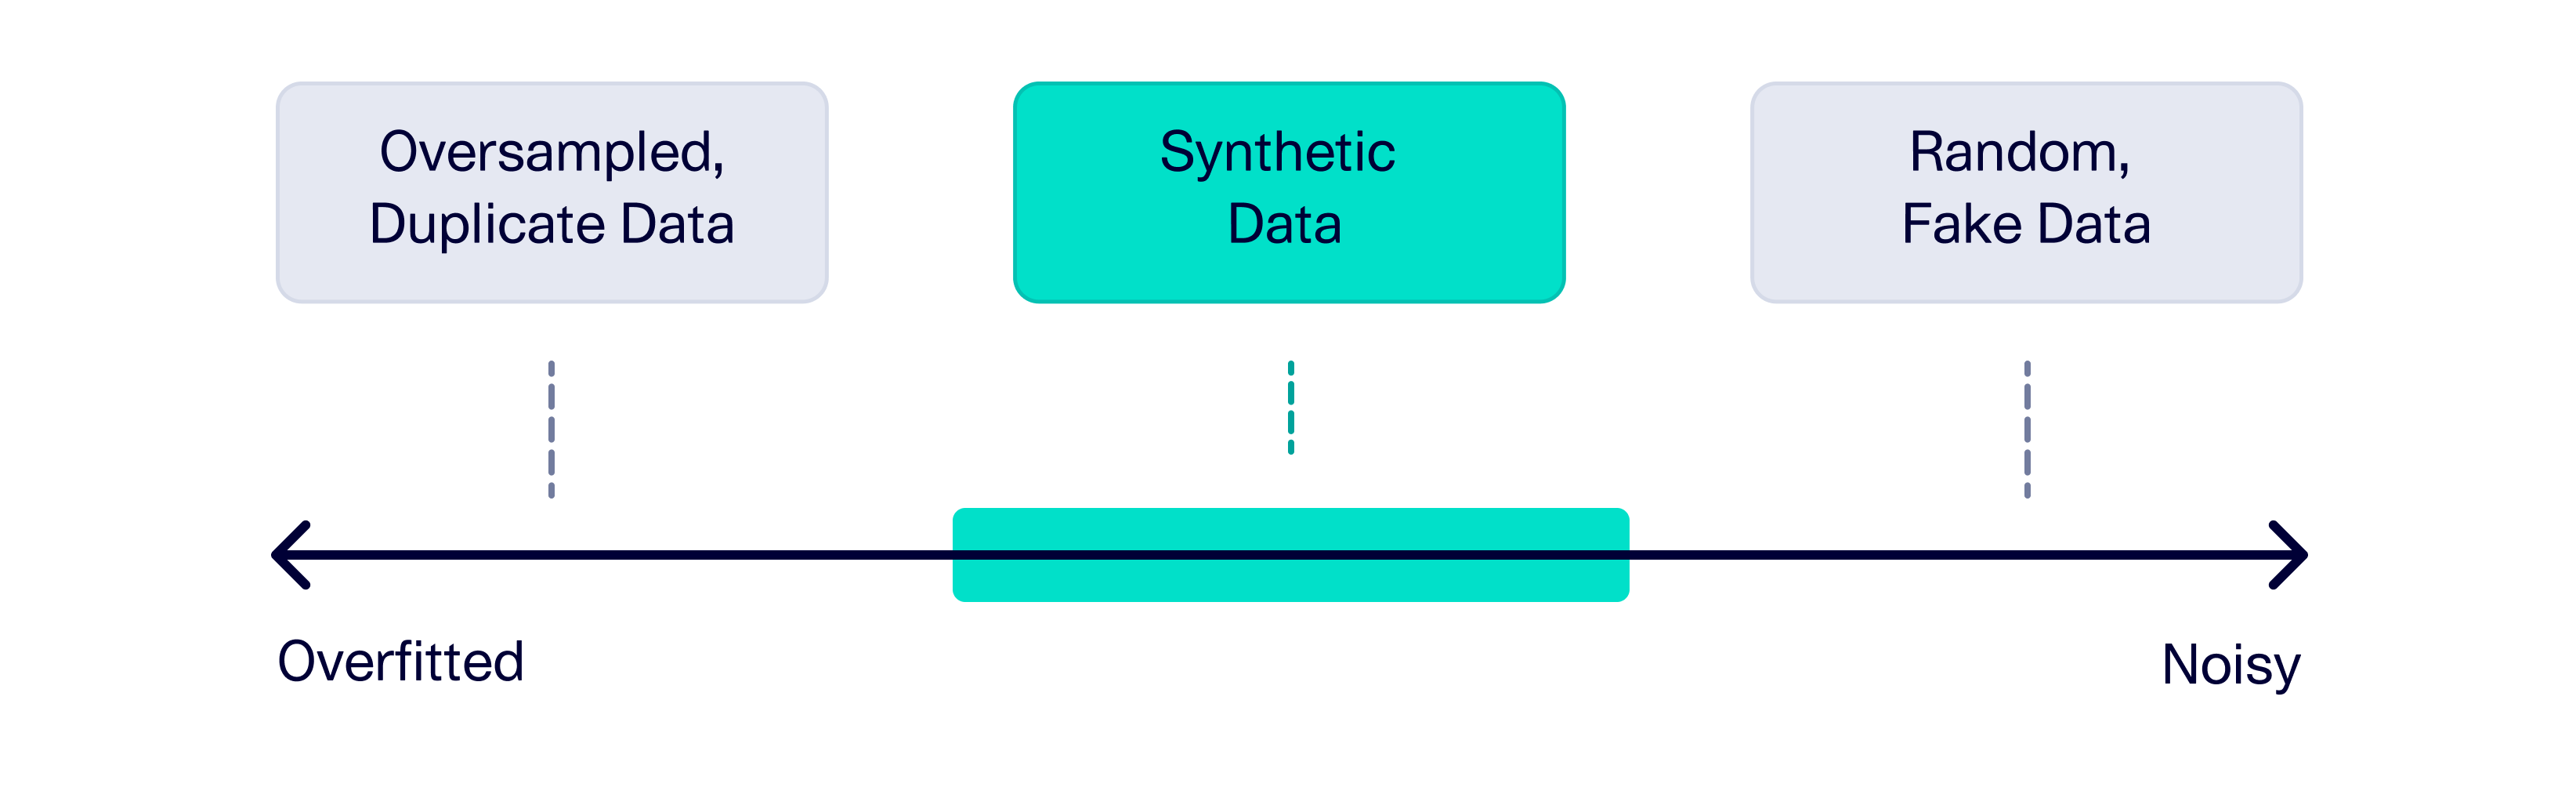
A Better Solution: Defining Neighborhoods
So far, we've seen attempts at extreme ends.
- Oversampling will emphasize one set of patients, leading to an overfit model
- Randomizing will make the dataset noisy, precluding useful conclusions
The solution we need falls somewhere in the middle: We'd like to loosely base the artificial patients on the real ones. This is related to the data science concept of neighborhoods. Drawing a neighborhood around some patients identifies general commonalities between them – without setting any strict rules. For example, Variant X patients may be more likely to have had a known exposure, but it's not guaranteed. Note that there is no exact definition for a neighborhood. It can change based on our assumptions and how broad we want to make it.
Once we know a neighborhood, we can create artificial patients that are inside it. These patients won't be exactly the same as the existing ones, but they won't have completely random values either.
Synthetic Data for Label Balancing
A compelling solution for discovering neighborhoods is synthetic data. A synthetic data software – such as our open source Synthetic Data Vault (SDV) – uses machine learning to learn patterns from real patients, and then creates synthetic patients.
The SDV discovers neighborhoods at a variety of levels in the form of trends. It's able to learn overall trends (for all patients) as well as trends that are unique to a variable (such as Variant X). For example:
- For all patients, a higher age corresponds to a greater risk of dementia and a higher BMI corresponds to a greater risk of diabetes.
- Variant X patients tend to be older, while Omicron patients tend to be younger.
- Etc.
As a result, synthetic patients have some variation – but the data still makes sense in context. An example table of SDV-generated patients is shown below.
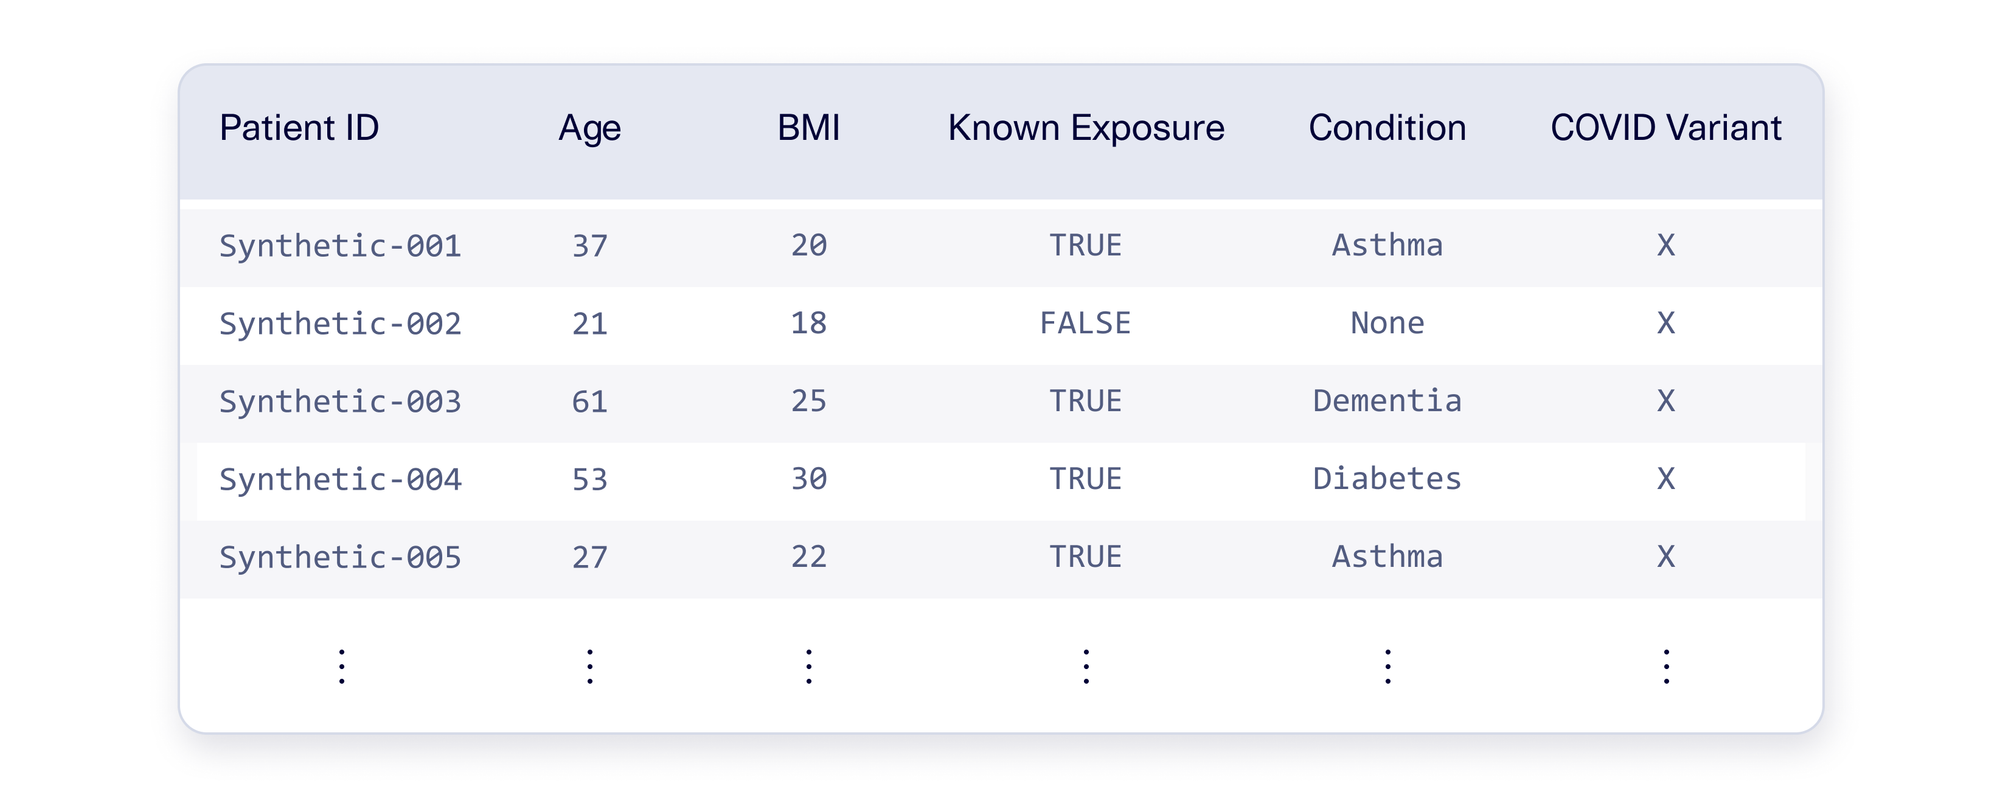
This is the middle solution we were looking for: Synthetic data won't cause overfitting and is less noisy than randomization. The best part is that there are multiple synthetic data techniques and settings available in the SDV, providing flexibility and tradeoffs.
Takeaways
In this article, we explored imbalanced datasets. It is common to have an imbalanced dataset due to rare events – which becomes a problem if those rare events are important for your project.
Fixing the imbalance problem requires a careful tradeoff between overfitting data and creating noisy data. Synthetic data is a compelling solution that achieves a middle ground by discovering neighborhoods of similar data. This allows you to realistically fix the imbalance without resorting to either extreme.
Are you interested in label balancing? Have you already explored using the SDV for this problem? Drop us a comment below!