In December 2022, many of us trying to fly during the holidays got caught in the airport during country-wide, mass flight cancellations. It's clear that adverse weather directly causes flight disruptions. But weather can also be a catalyst for other issues, straining airline resources and leading to cancellations even after the storms have passed.
While we can't control the weather, we can control how an airline's software responds to it – an area where synthetic data can help. Imagine if instead of waiting for an extreme storm, you could simulate a hypothetical one. Using synthetic data, you could test your software's resilience with worst-case scenarios until you were confident it could respond well – saving time and money when a storm actually comes.
To demonstrate this, we used the SDV to create a flight synthesizer that simulates adverse weather scenarios and their consequences. Today, we're making it available to the public to showcase how crucial synthetic data can be for building robust systems.
The SDV Flights Synthesizer
The SDV Flights Synthesizer produces realistic synthetic flights within the US, and simulates how they will be affected by adverse weather scenarios. Our synthesizer is built on top of the open source SDV library.
The synthesizer includes a pre-trained model that is ready to create synthetic data. Each synthetic flight corresponds to an actual, scheduled flight in 2017 – but specific information about each trip is completely synthetic, and changes in response to different simulated scenarios.
Use Case: Simulating an Adverse Weather Scenario
When using the SDV Flights Synthesizer, you can construct a weather scenario based on the month, storm severity and affected region. These controls are crucial to simulating a specific weather event.
- Month: The month of the year affects the flight schedule. Based on seasonal demand, airlines may increase the frequency of flights in a specific area. Our API uses numbers from 1 (January) to 12 (December) to represent the months.
- Severity: The severity of the storm affects the number of cancellations. In the simulation, you'll see more cancellations as the storm severity increases. You can specify this using the designations from the Winter Storm Severity Index; for example,
EXTREMEis the most severe, followed byMAJOR. - Region: Flights departing from and arriving to an affected region are more likely to experience disruptions. We use the region designations from the US Federal Aviation Administration. For example,
GREAT_LAKESrefers to the states bordering the Great Lakes, including Wisconsin, Illinois, Indiana, Michigan, Ohio, Montana and the Dakotas.
These controls allow for over 500 unique weather scenarios. We can create one using the code below.
import flights_synthesizer
synthetic_flights = flights_synthesizer.generate_trips_during_storm(
month=11,
num_flights=1000,
severity='EXTREME',
region='GREAT_LAKES'
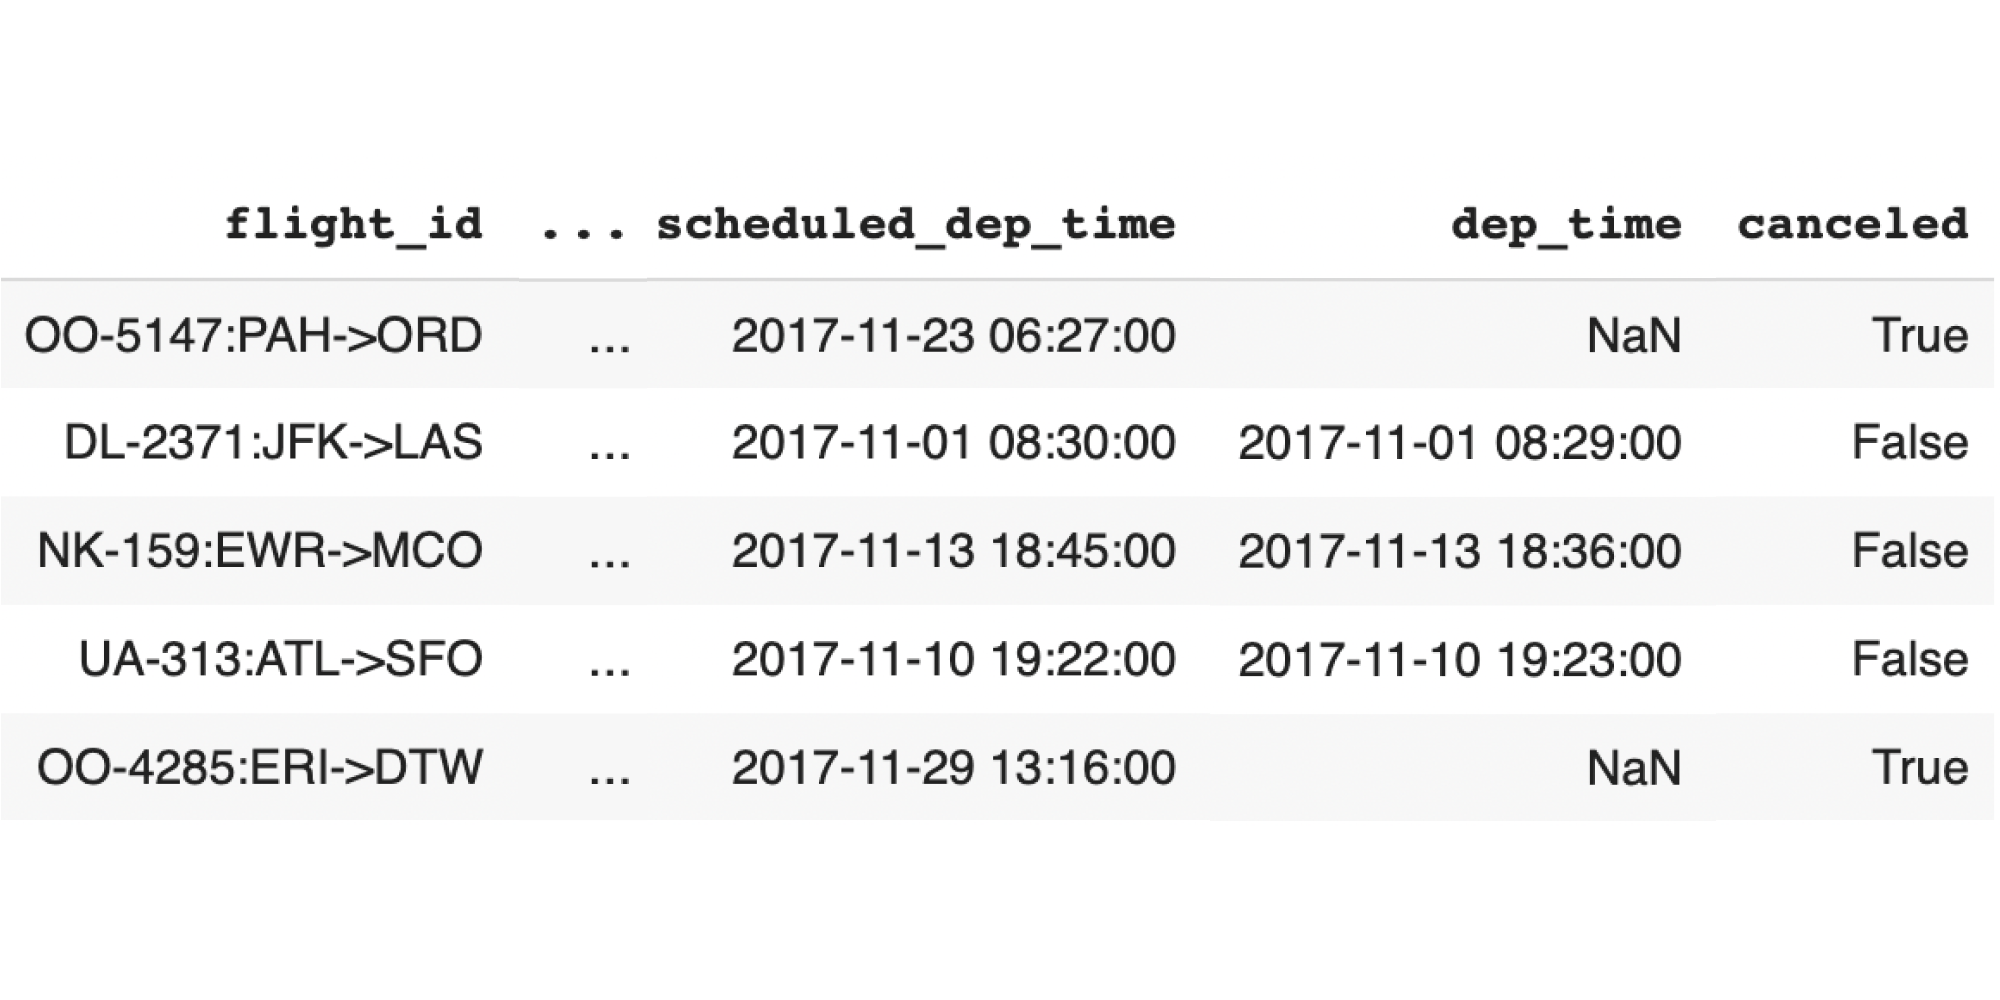
)The output is a detailed flight log corresponding to the scenario.
You can also visualize the cancellations on a US map to get a feel for the simulated scenario.
us_map = flights_synthesizer.visualize_cancellations(
   data=synthetic_flights
)


us_map.show()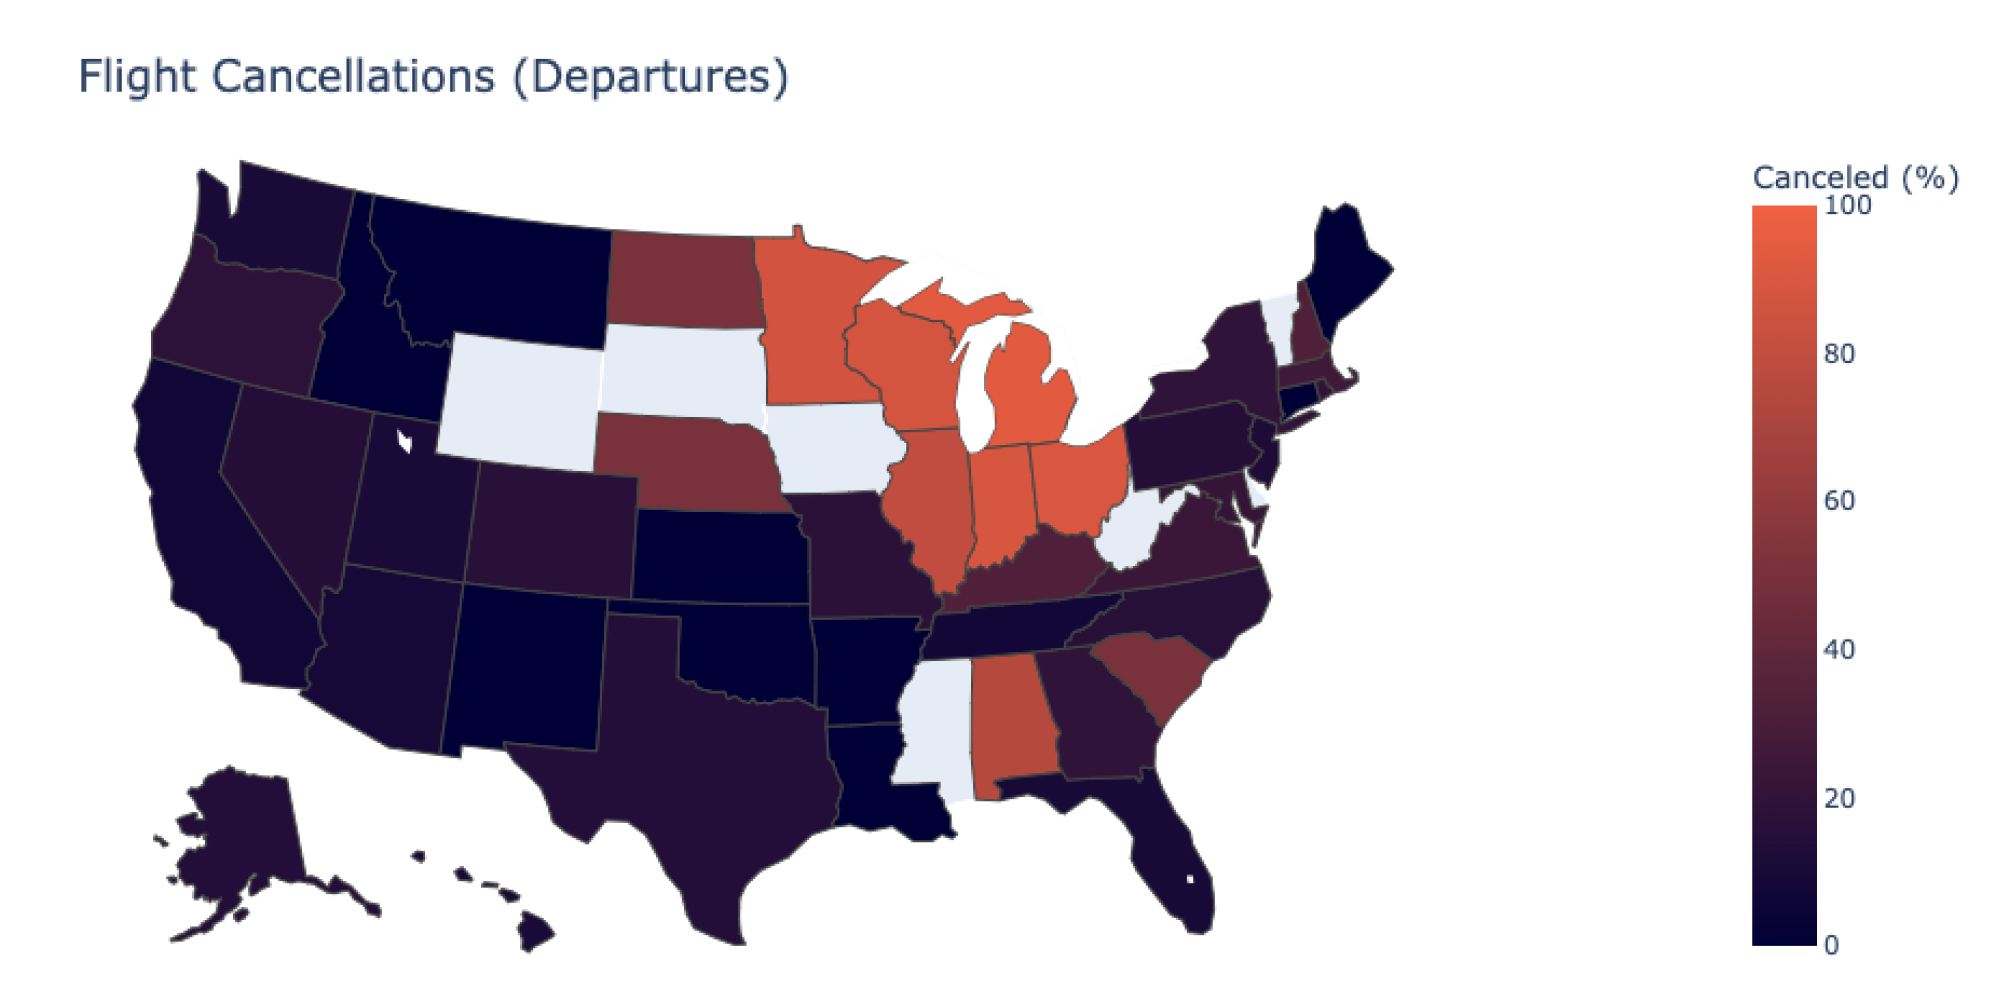
In our case, we can verify that the Great Lakes region has a larger percentage of cancellations than others. (A few other states may also show more cancellations as ripple effects – these are states that had many direct flights to and from the affected region.)
What other scenarios can we simulate?
Many airline operations rely on software, including:
- Flight scheduling systems, which rebook passengers to new flights, reroute crews and reassign planes.
- Pricing algorithms, which provide options for passengers who are searching for new flights.
- Airline insurance systems, which protect passengers in case of future cancellations.
The SDV Flights Synthesizer is available to the public today – but this is only a starting point. We're excited to see how our scenario generation algorithms can continue to develop along several fronts:
- Improving the scenario's scope. Currently, the SDV flights synthesizer achieves the main goal of simulating cancellations based on storm scenarios. But there are also other, second-order effects to storms, such as delays due to damage or operational hazards. We can also offer more granular scenario generation, such as storms affecting a particular day, airport or airline.
- Adding new types of scenarios. Besides stormy weather, there may be other simulations that are useful. For example, simulating entirely new, direct flight paths between airports could help newer airlines and pricing software understand the effects of adding such paths.
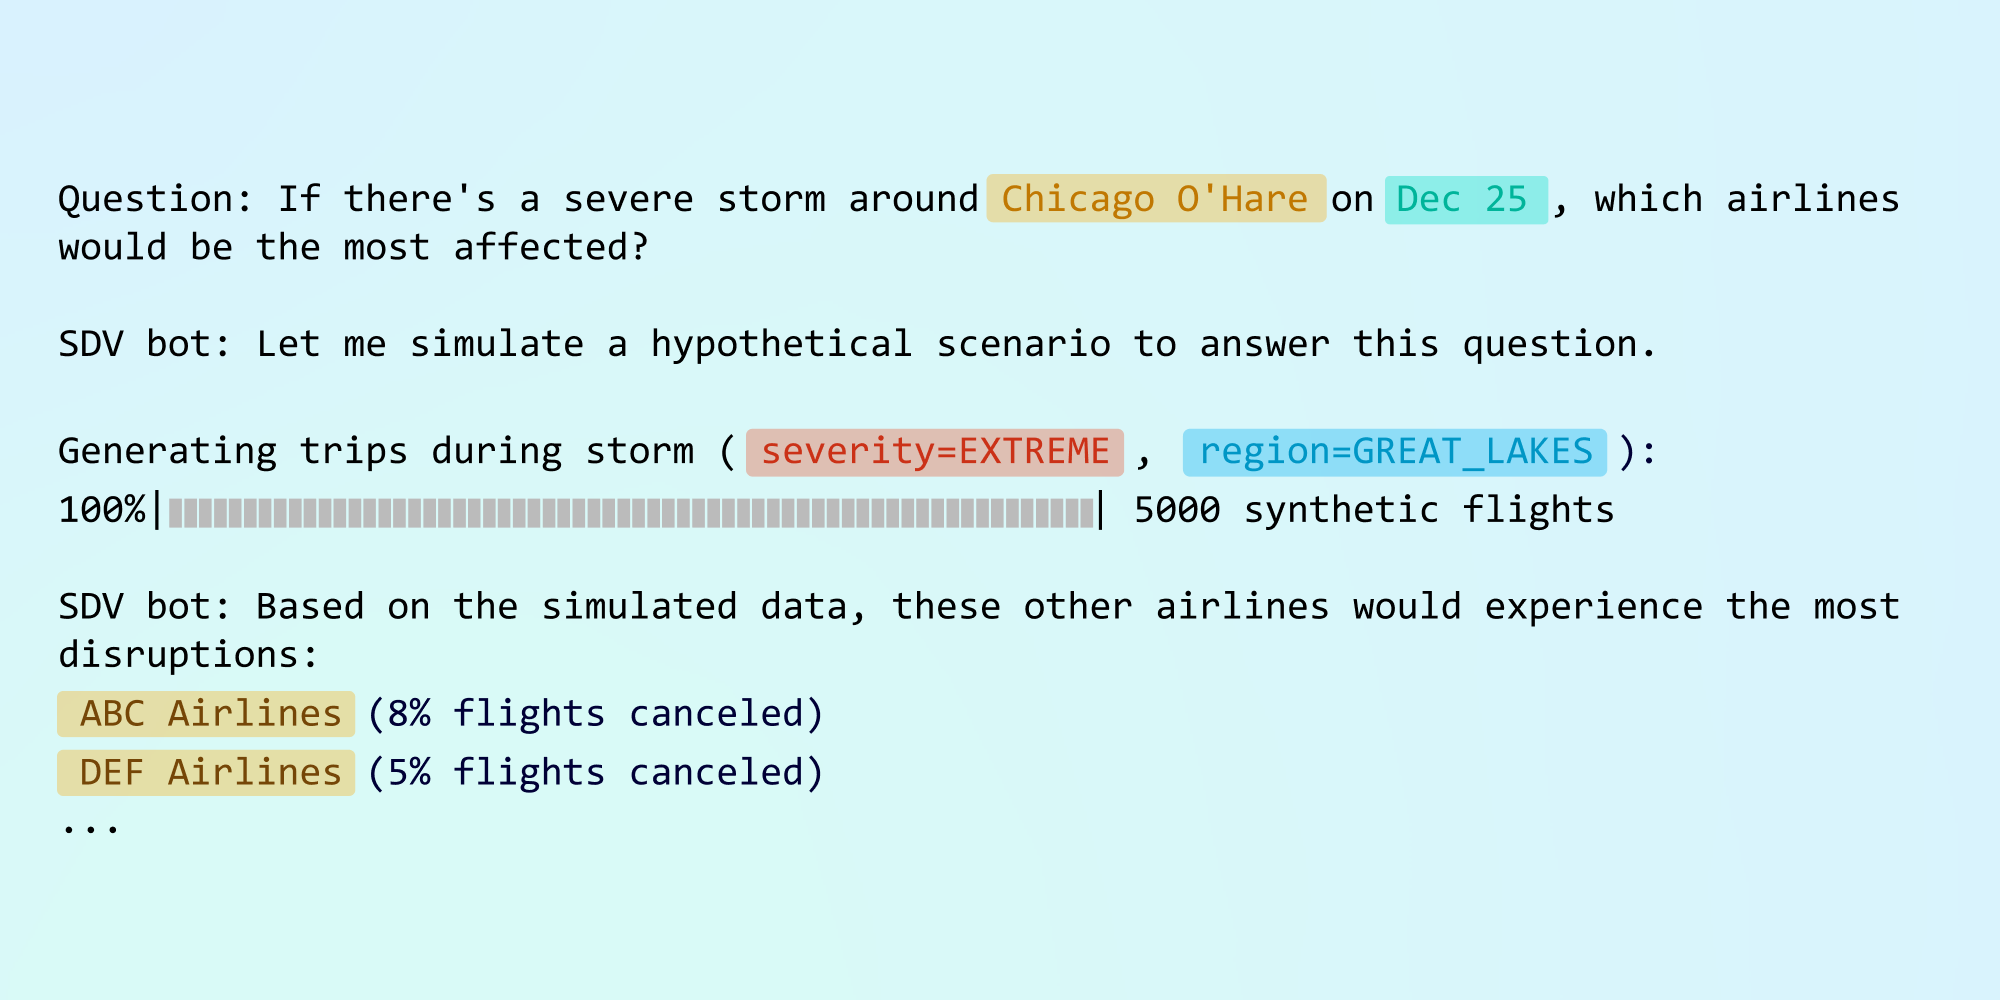
- Query-based summarization. Finally, we can use the simulated data to answer basic queries that our users may have about hypothetical scenarios. Such a functionality could even allow users to interact with our software in a chat-based format. A fictional example is shown below.
The SDV Methodology for Adverse Flight Conditions
Our synthesizer is based on real data. Using machine learning, the SDV learns just enough from the real data to simulate realistic weather scenarios.
Choosing a real dataset and understanding it becomes crucial to creating quality synthetic data. In the rest of this section, we'll go through an overview of terms and concepts from the airline industry – and how they're incorporated in our synthesizer to make the data realistic.
Using Real Flight Data
To build our flight synthesizer, we started with a dataset of real flights from 2017, provided by the US Bureau of Transportation Statistics (BTS). The dataset is available as a single table.
Each row corresponds to a scheduled, domestic flight within the US, but as we all know, flights don't always go according to schedule. The table also logs information about what actually happened to the flight:
- Was it canceled?
- Was it diverted to another airport?
- Were there any delays?
We considered the planned schedule to be reference information. We then use information from the real trip log to create data for a new, synthetic trip log.

This is an important component to building our synthesizer. Each synthetic flight we create corresponds to a real flight – as determined by the reference information. But the data about the trip's actual timeline is synthetic, and responds to different scenarios.
Synthesizing a Valid Flight Timeline
Our synthesizer creates new delay information based on the inputted scenario. Although this information is synthetic, the delays need to make sense in context.
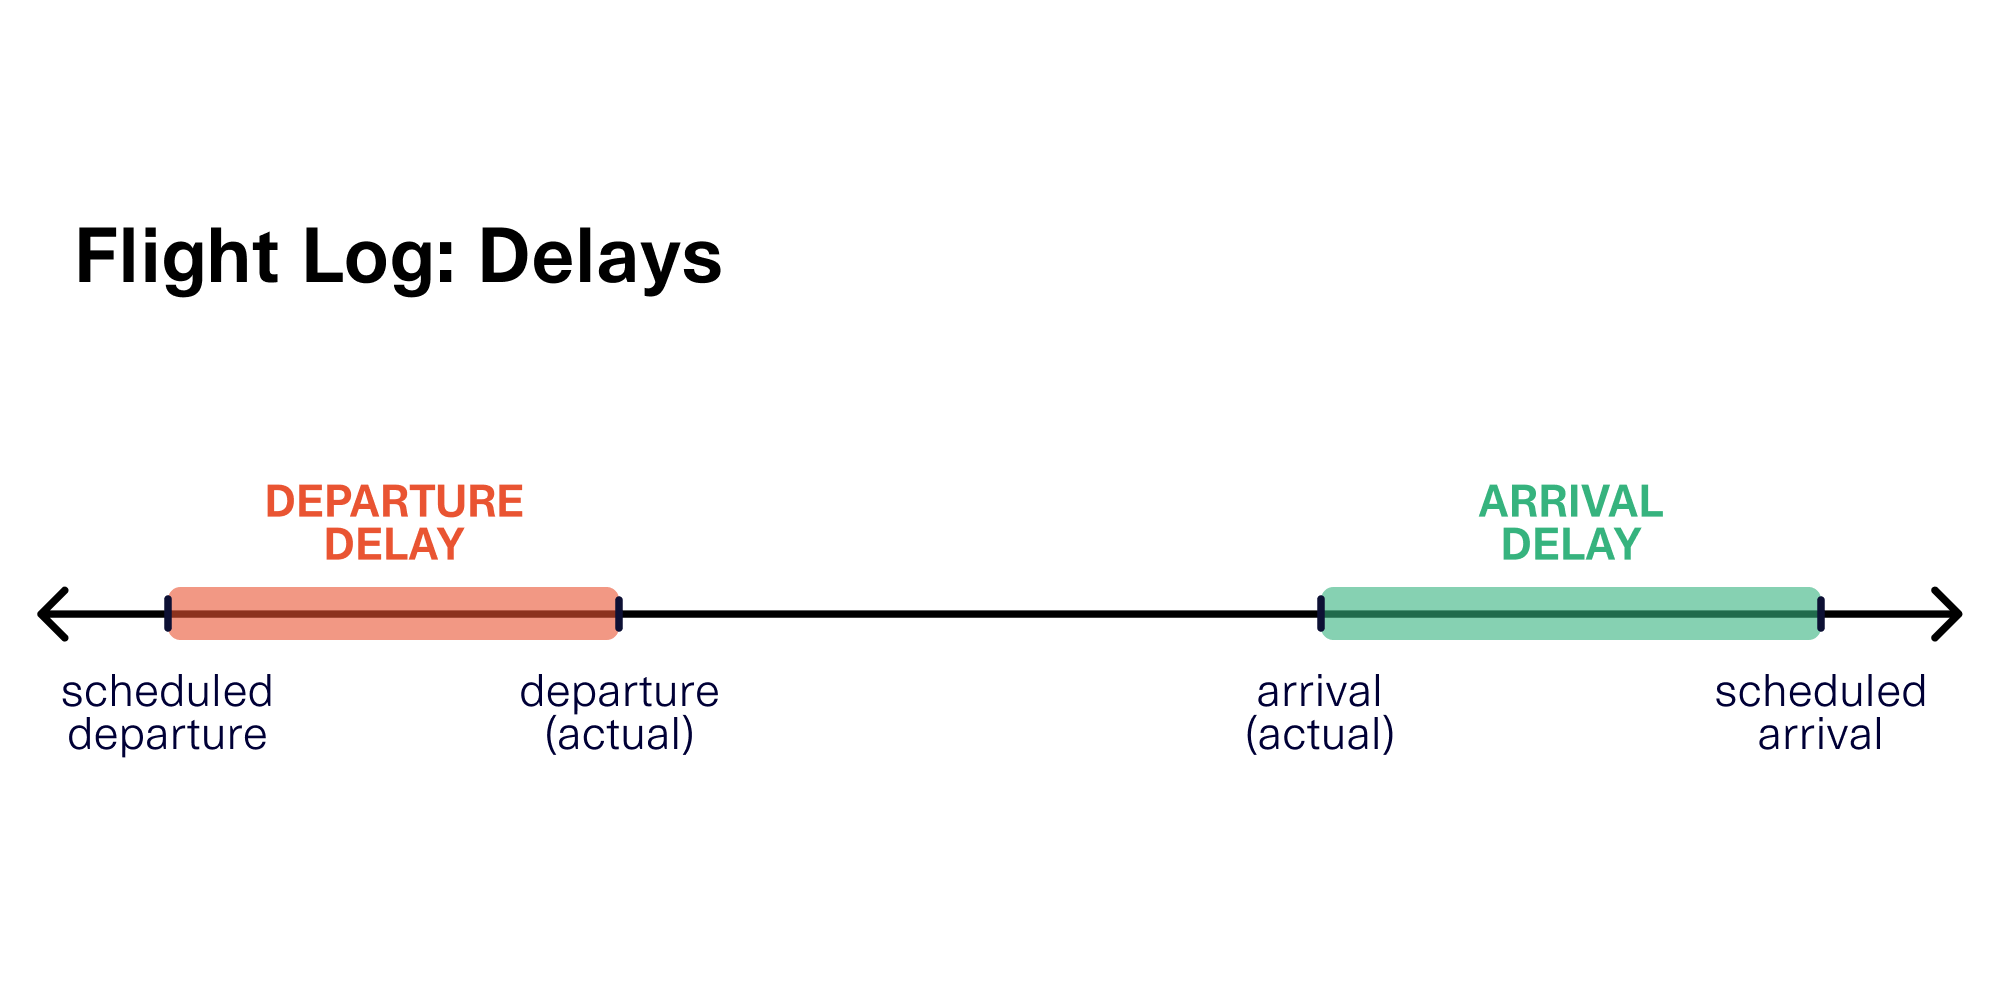
Each flight has a departure delay and an arrival delay measuring how close the flight was to its scheduled times. The departure and arrival are separate concepts, because they are not necessarily in sync. For example, a flight may leave late but then make up for the time in the air (by prioritizing a faster route), leading to an on-time arrival. In the best case scenario, the delays may even be negative, indicating that the flight is early.
Our synthetic data ensures that the departure and arrival delays make sense with the scheduled and actual times. This is illustrated below.
If there is an arrival delay, some flights also break down the reason according to the BTS definitions. This can be crucial for many use cases, as it describes who was at fault – the airline, the airport, the National Aviation System, etc.
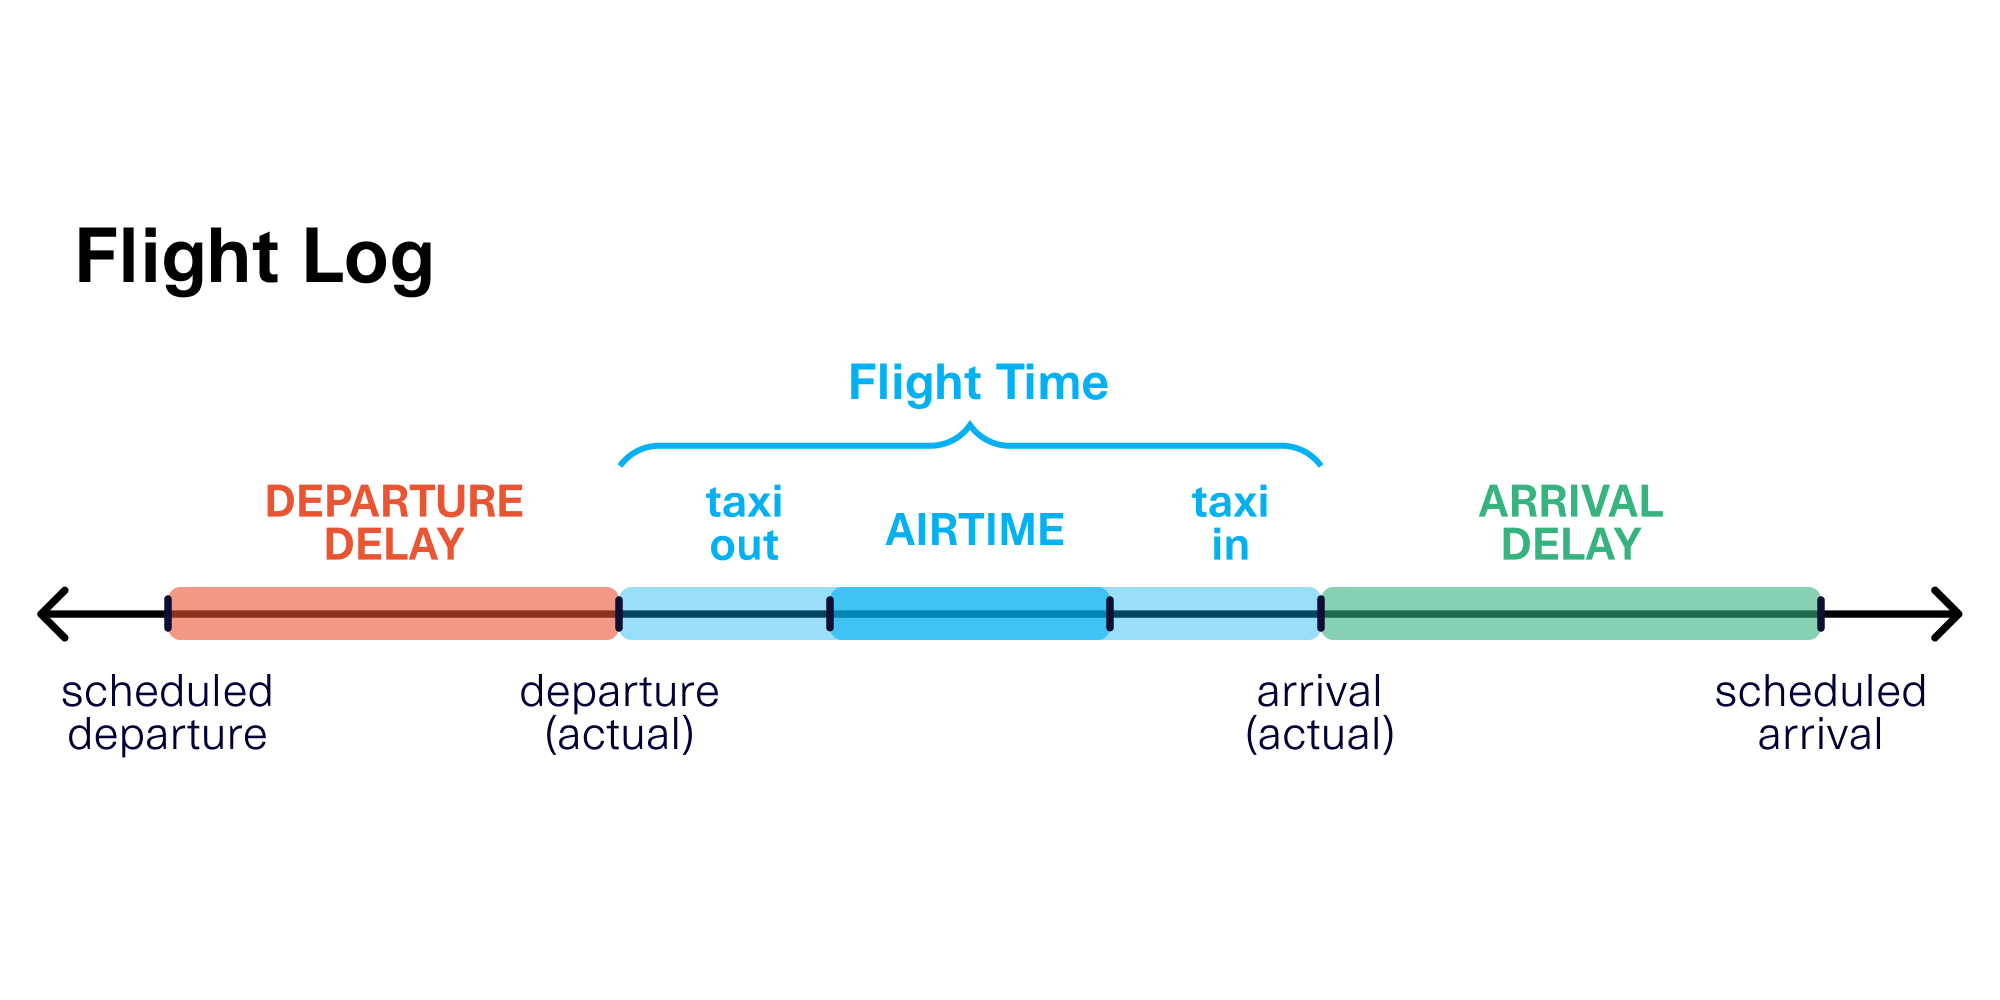
A flight's departure and arrival times are based on when the flight leaves the departure gate and arrives at the destination gate. The BTS captures 3 key phases that happen in between the origin and destination gates:
- Taxi out: The time the plane spends on the runway before it takes off
- Airtime: The time the plane spends in the air
- Taxi in: The time the plane spends on the runway after it lands
Together, these 3 times make up the total flight time.
In our synthesizer, we make sure that all parts of the record – from the delays to the flight times – add up to create a valid flight timeline.
Try it out!
The SDV Flights Synthesizer is available to the public under a Business Source License. Get started by visiting bit.ly/sdv-flights.
If you have any feedback or thoughts, we'd love to hear them below. And if you have any questions about our license or commercial interests, you can always contact us.
Happy synthesizing!