The Synthetic Data Vault (SDV) is a software system that allows users all over the world to input a dataset and generate synthetic data. The SDV was born out of academic research at MIT — but in 2018, we open-sourced it, so that people all over the world could use it.
Since then, we've been listening carefully to our community's feedback, making sure that we address any gaps between theoretical academic research and practical use. This article is the second in a multi-part series detailing recent improvements to the SDV that make it work in the real world. Here we'll discuss how we've amped up the data synthesis workflow. (For our previous discussion about how we've improved core models, see Part 1.)
What are workflows?
We open sourced the SDV not just to let users generate synthetic data, but also to allow them use that data to solve real-world problems. Our community taught us that actually using the SDV involves a multi-step process — and that improving the system means paying attention to this entire workflow, not just the core machine learning.
According to our users, this workflow boils down to a few generalizable steps:
- Identifying real datasets that need to be synthesized
- Transforming the datasets into a machine-readable format
- Running the machine learning model
- Synthesizing data according to particular specifications
- Reversing the transformations such that the synthesized data looks like the original
- Evaluating the synthesized data that results
These steps are illustrated in the diagram below.
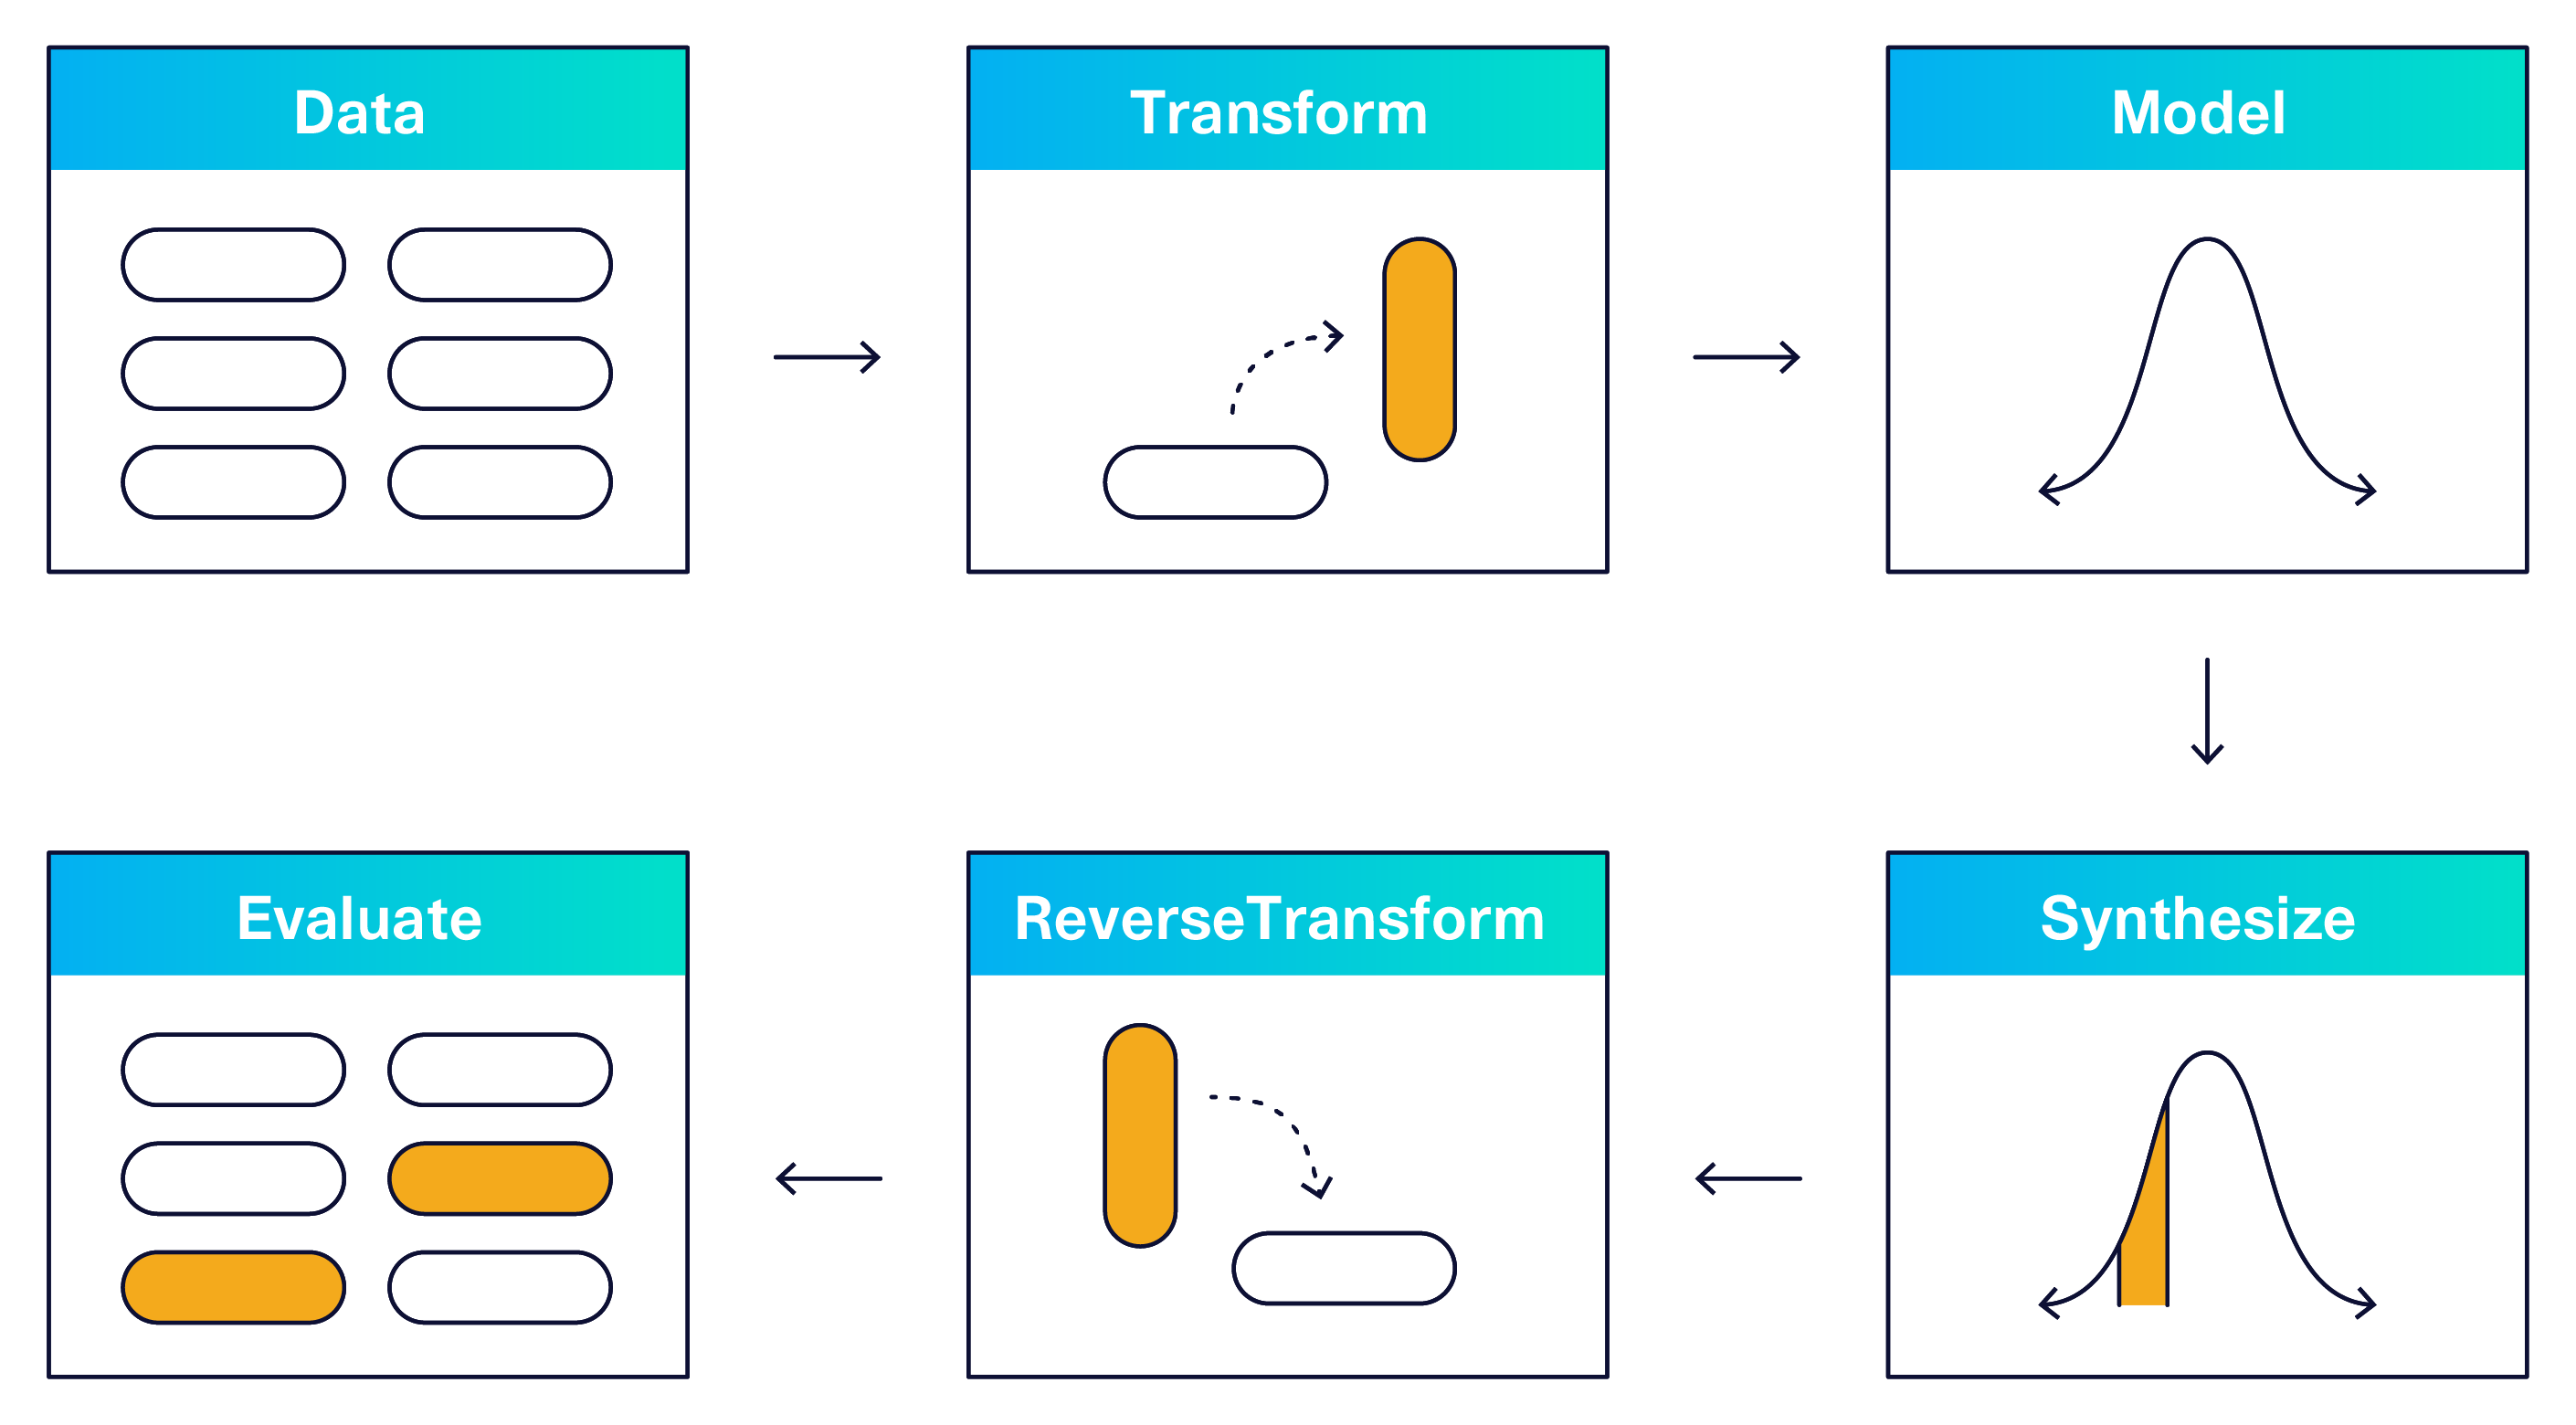
The key insight from our users was that the application of machine learning models is only one step of a much larger puzzle. When the open source community helped us understand this, we were able to improve on the SDV software by adding in transformations, synthesizing options, and evaluation tools -- all detailed below.
Transforming Data
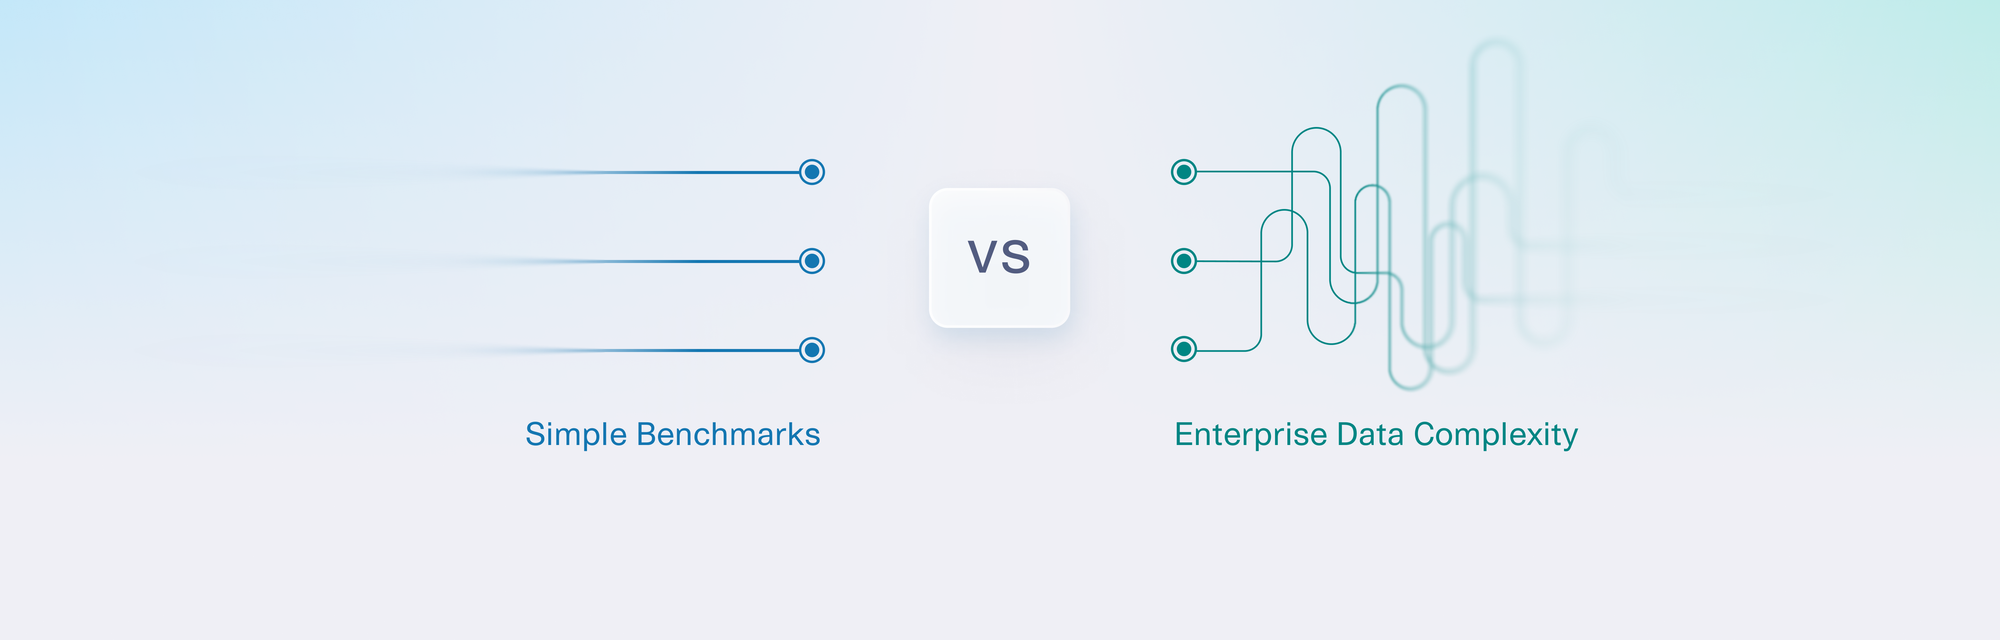
One major lesson from our open source community was how messy real-world datasets are compared to those used in academia. Academic datasets often come pre-sanitized and ready for numerical use. In the real world, however, databases are growing and changing constantly, and are often significantly different from the optimal yet theoretical structures used by machine learning researchers.
Two thorny data types frequently encountered in the real world are datetimes and null values.
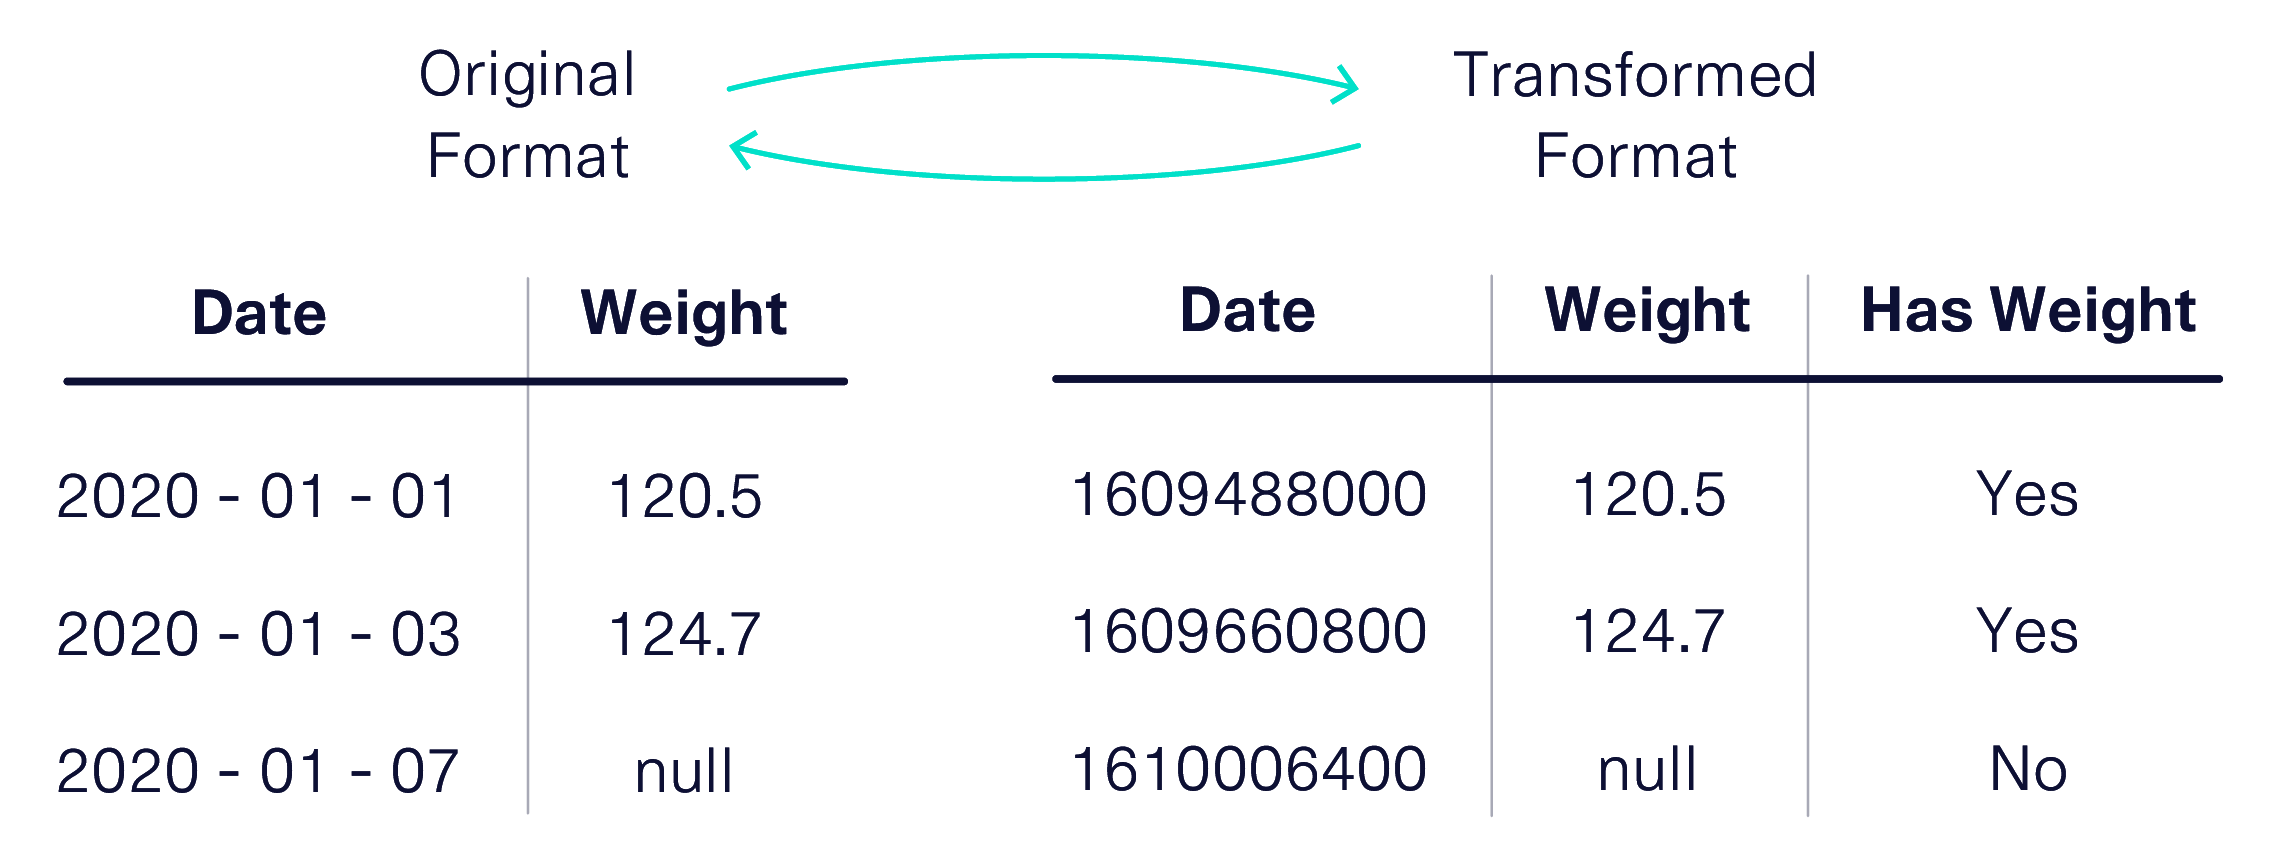
- Datetimes can follow many different formats, including YYYY-MM-DD or MM-DD-YY. However, machine learning models accept numerical values only. Usually these are Unix timestamps, defined as the number of seconds that have elapsed since January 1, 1970. By this logic, a date like 2021-01-01 will transform into the number 1609488000.
- Null values also present a problem for mathematical models when they appear in numerical data. While users can tell models to ignore these values, the presence of a null might actually indicate something important, like a user declining to answer a question. To account for this, the SDV creates a new, binary column to address whether the original value is null.
To solve this problem, we introduced a new library called Reversible Data Transforms (RDT). The RDT library contains necessary logic for transforming different types of real world data to its machine-ready counterpart — as well as the logic for its reversal, so that a synthetic data user won't know the difference. The RDT is a standalone library that can reach beyond the synthetic data space, helping data scientists and academics across fields to clean their data. Since November 2020, the RDT has been supported on all major platforms including MacOS, Windows, and Linux.
Synthesizing Data Conditionally
When we first imagined the SDV, we assumed users would simply want to use all the synthetic data generated by the model. However, we soon found that some users have more complex needs, and require more control over the data they synthesize — opening up new possibilities for synthetic data in the process.
For example, one of our users, an engineer, found a whole new use for SDV. The engineer was writing a machine learning classifier on a dataset when they noticed it was unbalanced. Applying any algorithms to this dataset would lead to biased models. The engineer realized that, if used strategically, SDV could actually debias the data — if it only generated data with rarer attributes, the synthetic data it created could be combined with the real data to form a fully balanced dataset.
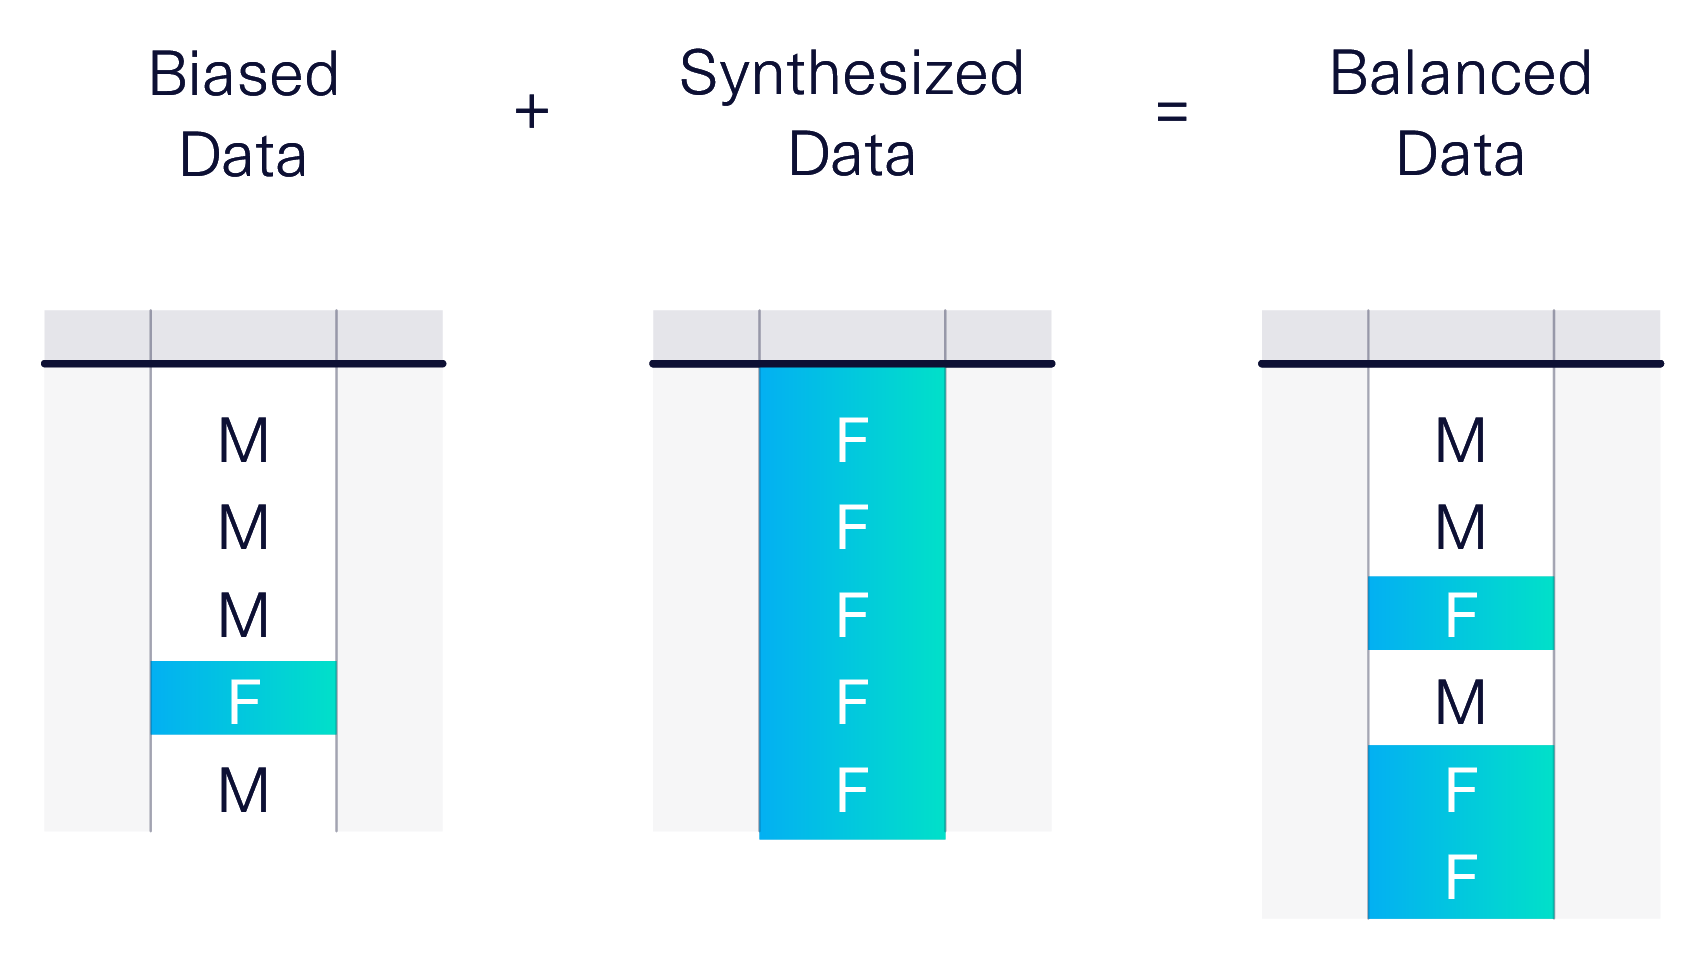
In February of 2021, we added conditional sampling to the SDV to enable this use case. Now, users can specify attributes or values that must be present in the synthesized data. In addition to debiasing datasets, users can use this feature to test hypothetical scenarios.
Evaluating Synthesized Data
When the entire system is working smoothly and outputting synthetic data, users still need to know: Is the data good enough to use? This vital question inspired us to add evaluation capabilities to the SDV. In doing so, we faced two key challenges: Defining the metrics, and creating a useful process.
Metrics
No single metric perfectly captures the different dimensions of synthetic data users may want to evaluate. Some want to preserve a high degree of mathematical likeness, others want to emphasize a particular column for machine learning predictions, and still others are more focused on threat models that can compromise privacy.
To address this, we created a separate library, SDMetrics, to define evaluation metrics. The library now includes a suite of metrics that cover differentiation of synthetic and real data, statistical likeness, and privacy.
Application
Rather than apply metrics on an ad-hoc basis, some SDV power users were creating mini-workflows to rapidly test out different models, datasets and evaluation criteria in succession. Inspired by their innovation, we created SDGym, a system that allows users to input models, datasets and success metrics to build a comprehensive evaluation framework.
The SDV Software Today
The SDV software is continuously evolving based on community feedback. In this article, we discussed improvements to the workflow surrounding synthetic data generation, including data transformations, sampling methods and evaluation tools. Earlier, in Part 1 of this series, we discussed the core synthetic data models themselves. In future blog articles, we plan to dig deeper into each of these areas, and to uncover new ones with you.
Like the SDV, this blog is a collaborative effort. Use our Slack to let us know which topics you'd like to hear more about. And as always, use GitHub to file technical issues with the system. Working together, we can make SDV the most trusted, transparent and comprehensive platform for synthetic data generation!
For other inquiries, please contact info@sdv.dev.