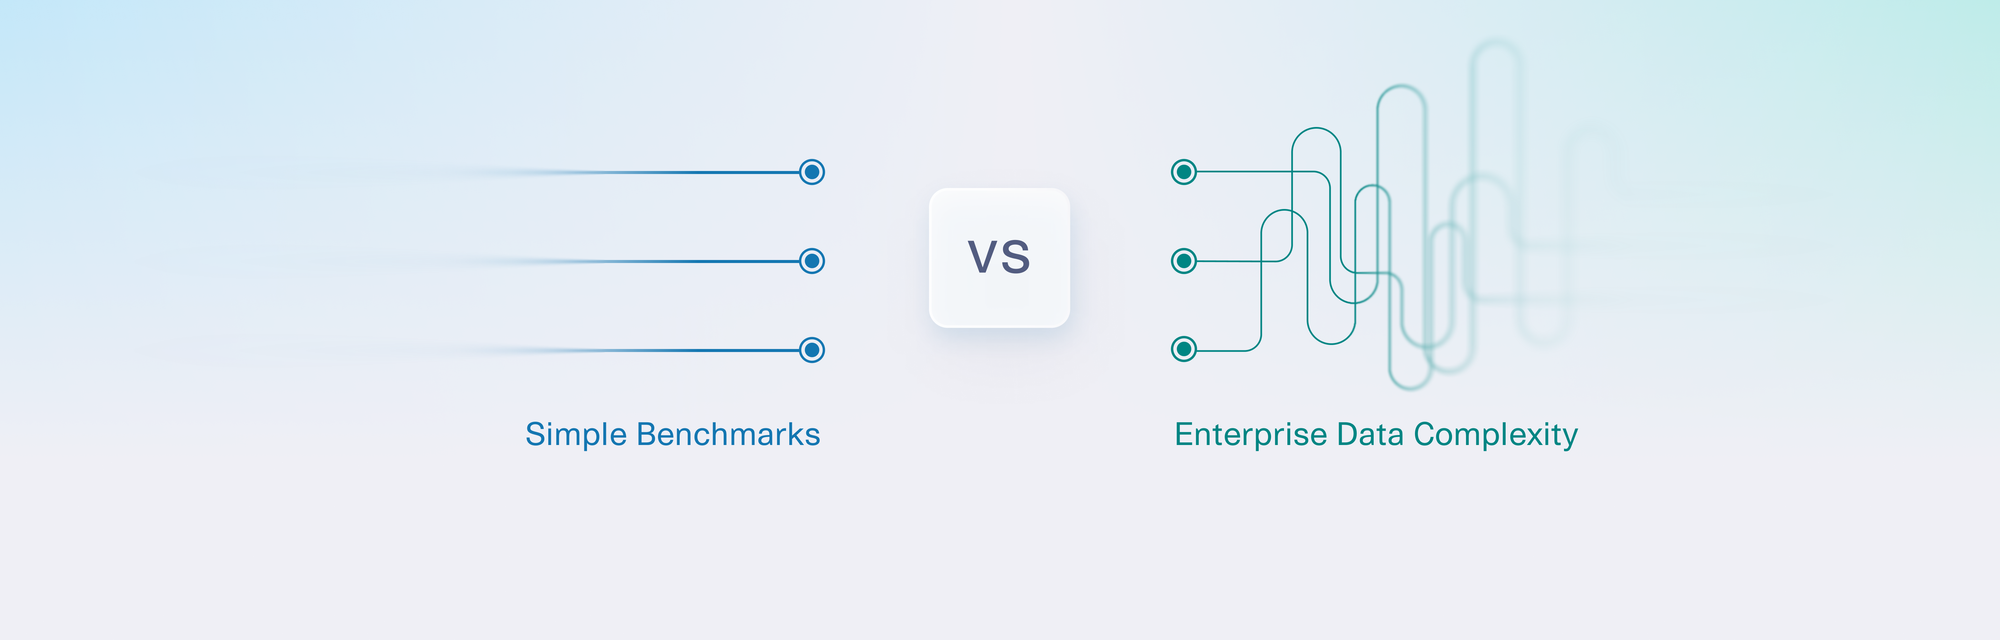
In recent years, synthetic data has shown great promise for solving a variety of problems – like addressing data scarcity for AI and overcoming barriers to data access. As your organization becomes serious about adopting synthetic data, it's crucial to incorporate the right metrics and evaluation frameworks into your projects.
Since the synthetic data space is so new, there aren't yet industry standards for setting and measuring outcomes. At DataCebo, we've worked with a variety of teams using synthetic data. In this article, we're sharing the best practices we've learned along the way, as well as the one key mistake to avoid.
What are synthetic data quality metrics?
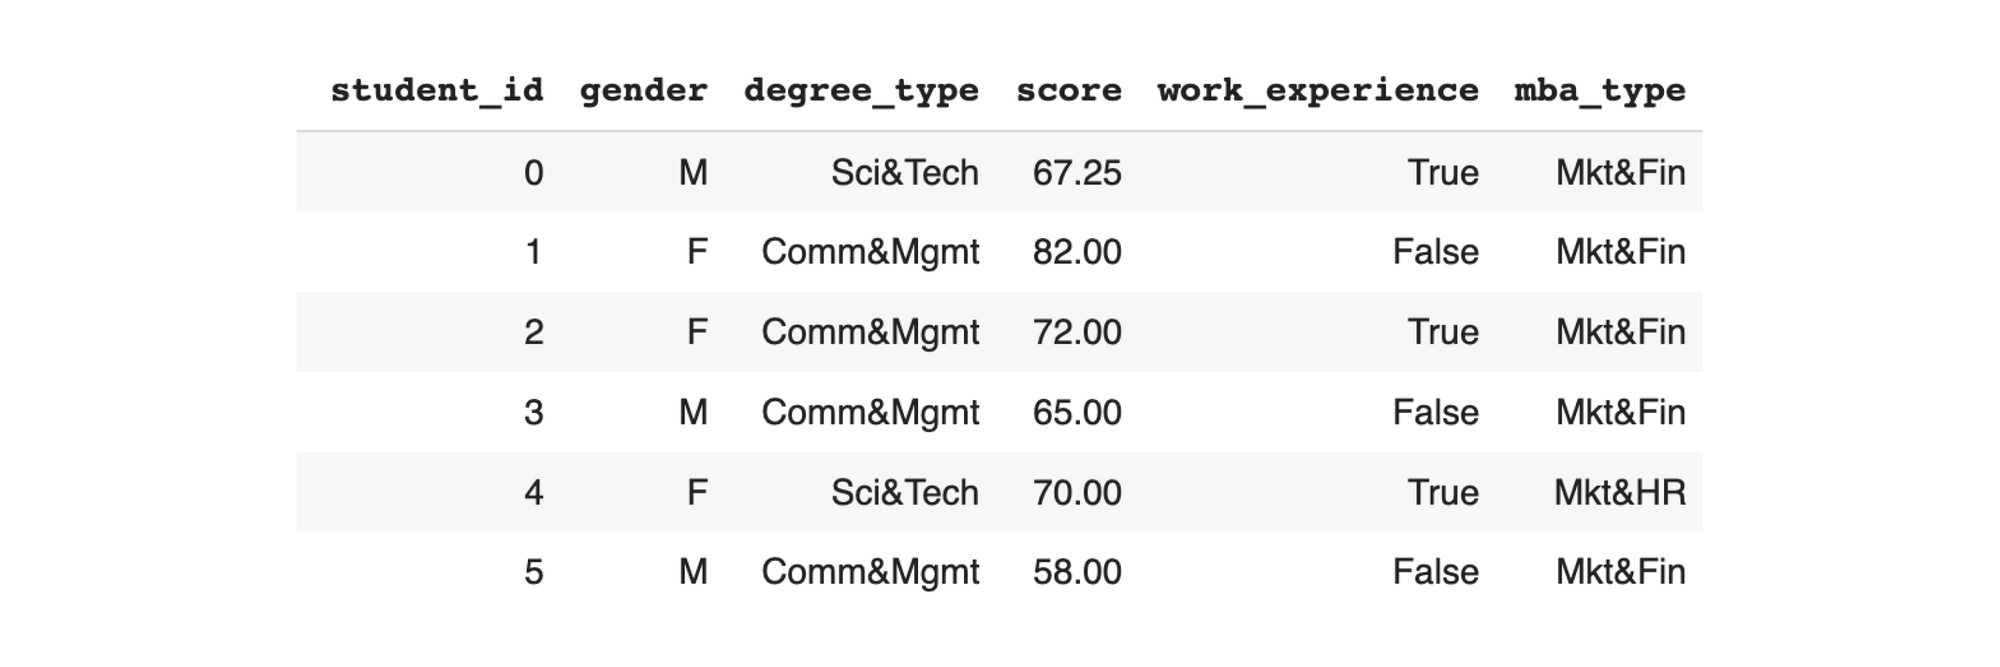
In some fields – such as synthetic image generation – it's easy to visually inspect the output (in this case, synthetic images) and determine its quality. But if you are creating synthetic data in a tabular format (with rows and columns), it's difficult to make an overall assessment just by looking at the raw data. This is evident in the table below:
For tabular synthetic data, it's necessary to create metrics that quantify how the synthetic data compares to the real data. Each metric measures a particular aspect of the data – such as coverage or correlation – allowing you to identify which specific elements have been preserved or forgotten during the synthetic data process.
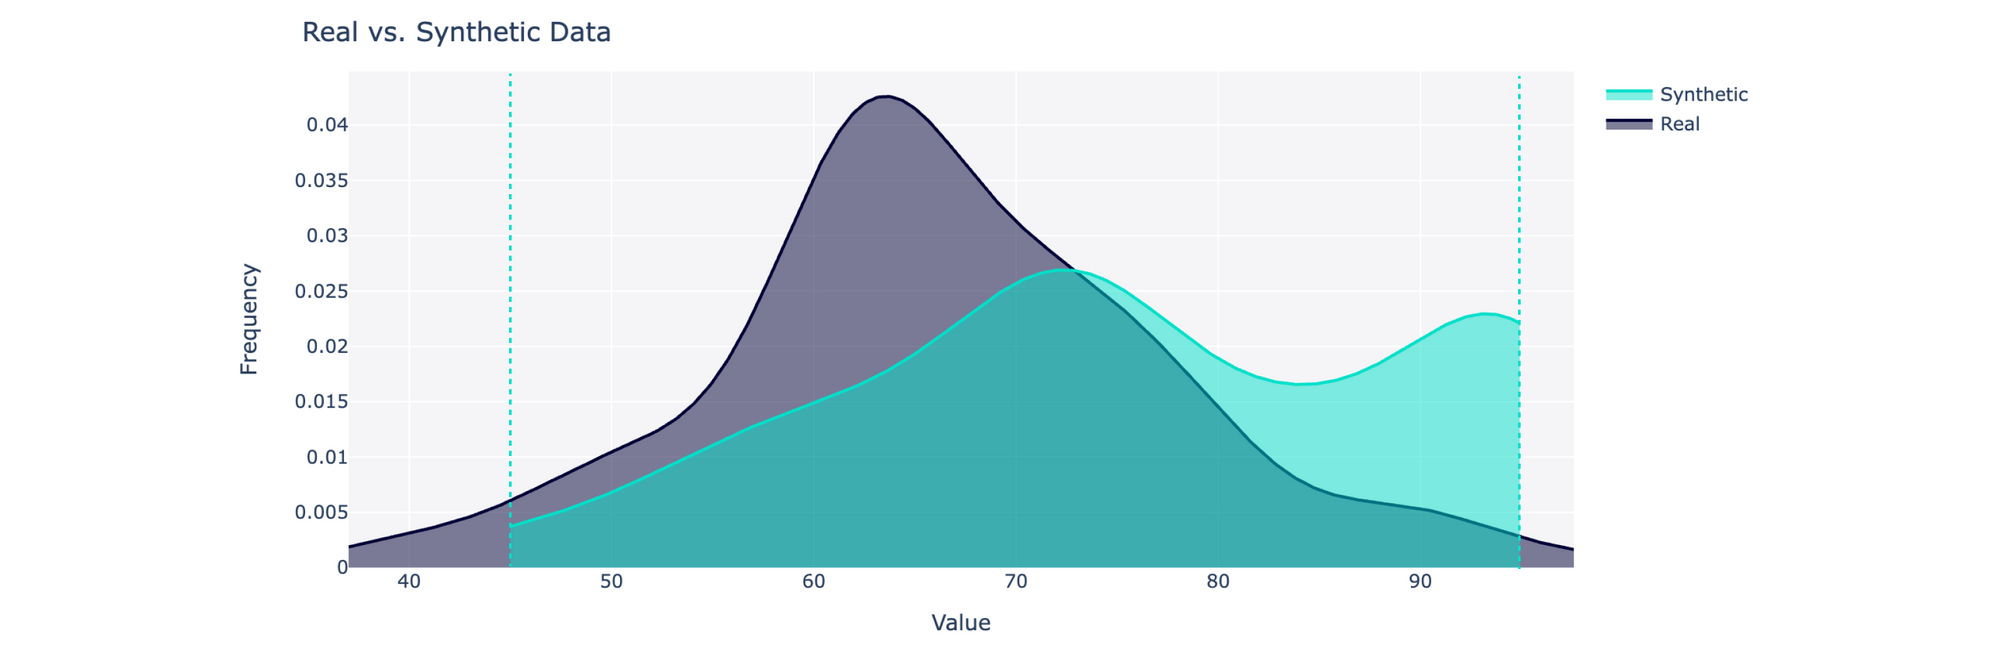
In our open source library, SDMetrics, we've provided a variety of metrics for evaluating synthetic data against the real data. For instance, you can use the CategoryCoverage and RangeCoverage metrics to quantify whether your synthetic data covers the same range of possible values as the real data:
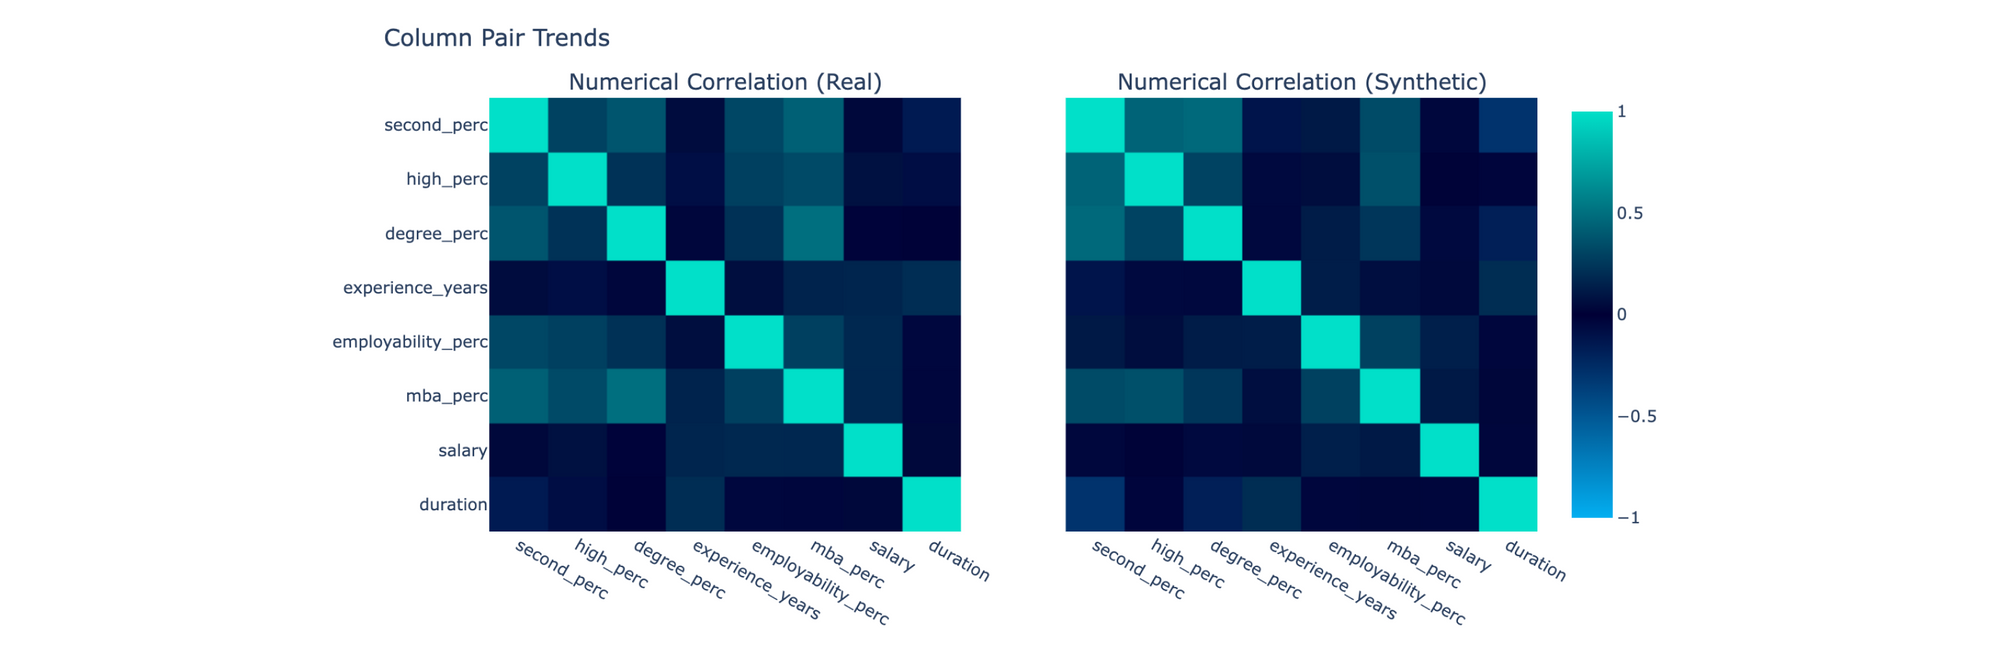
You may also be curious about whether the synthetic data captures trends between pairs of columns. To compare correlations, you can use the CorrelationSimilarity metric:
The SDMetrics library has over 30 metrics, with more still in development.
But having access to metrics is just one part of the story. With so many quality metrics, it can be difficult to decide which ones to focus on – and how to make progress in your synthetic data project. To successfully deploy synthetic data, it's important to consider metrics during all steps of your project development cycle.
In the rest of this article, we'll share a 3-step plan for incorporating metrics – and the SDMetrics library – into your synthetic data project to increase your chances of success.
Step 1: Start with the project goals
It is tempting to create synthetic data quickly and then test it using all the available metrics. After all, it's hard not to be curious about what synthetic data can do! But to succeed with your project, it's important to take a step back and focus on the problem you are trying to solve first.
Synthetic data creation isn't an end in itself. Just as with most data work, you don't create synthetic data for its own sake — you use it to solve a problem. If you want your synthetic data project to succeed, pay close attention to what that problem is, as this will help you narrow down a few key metrics.
For example, imagine that your organization has two different synthetic data projects related to software testing and machine learning, respectively. Because these projects have different goals, you’ll need to consider different metrics:
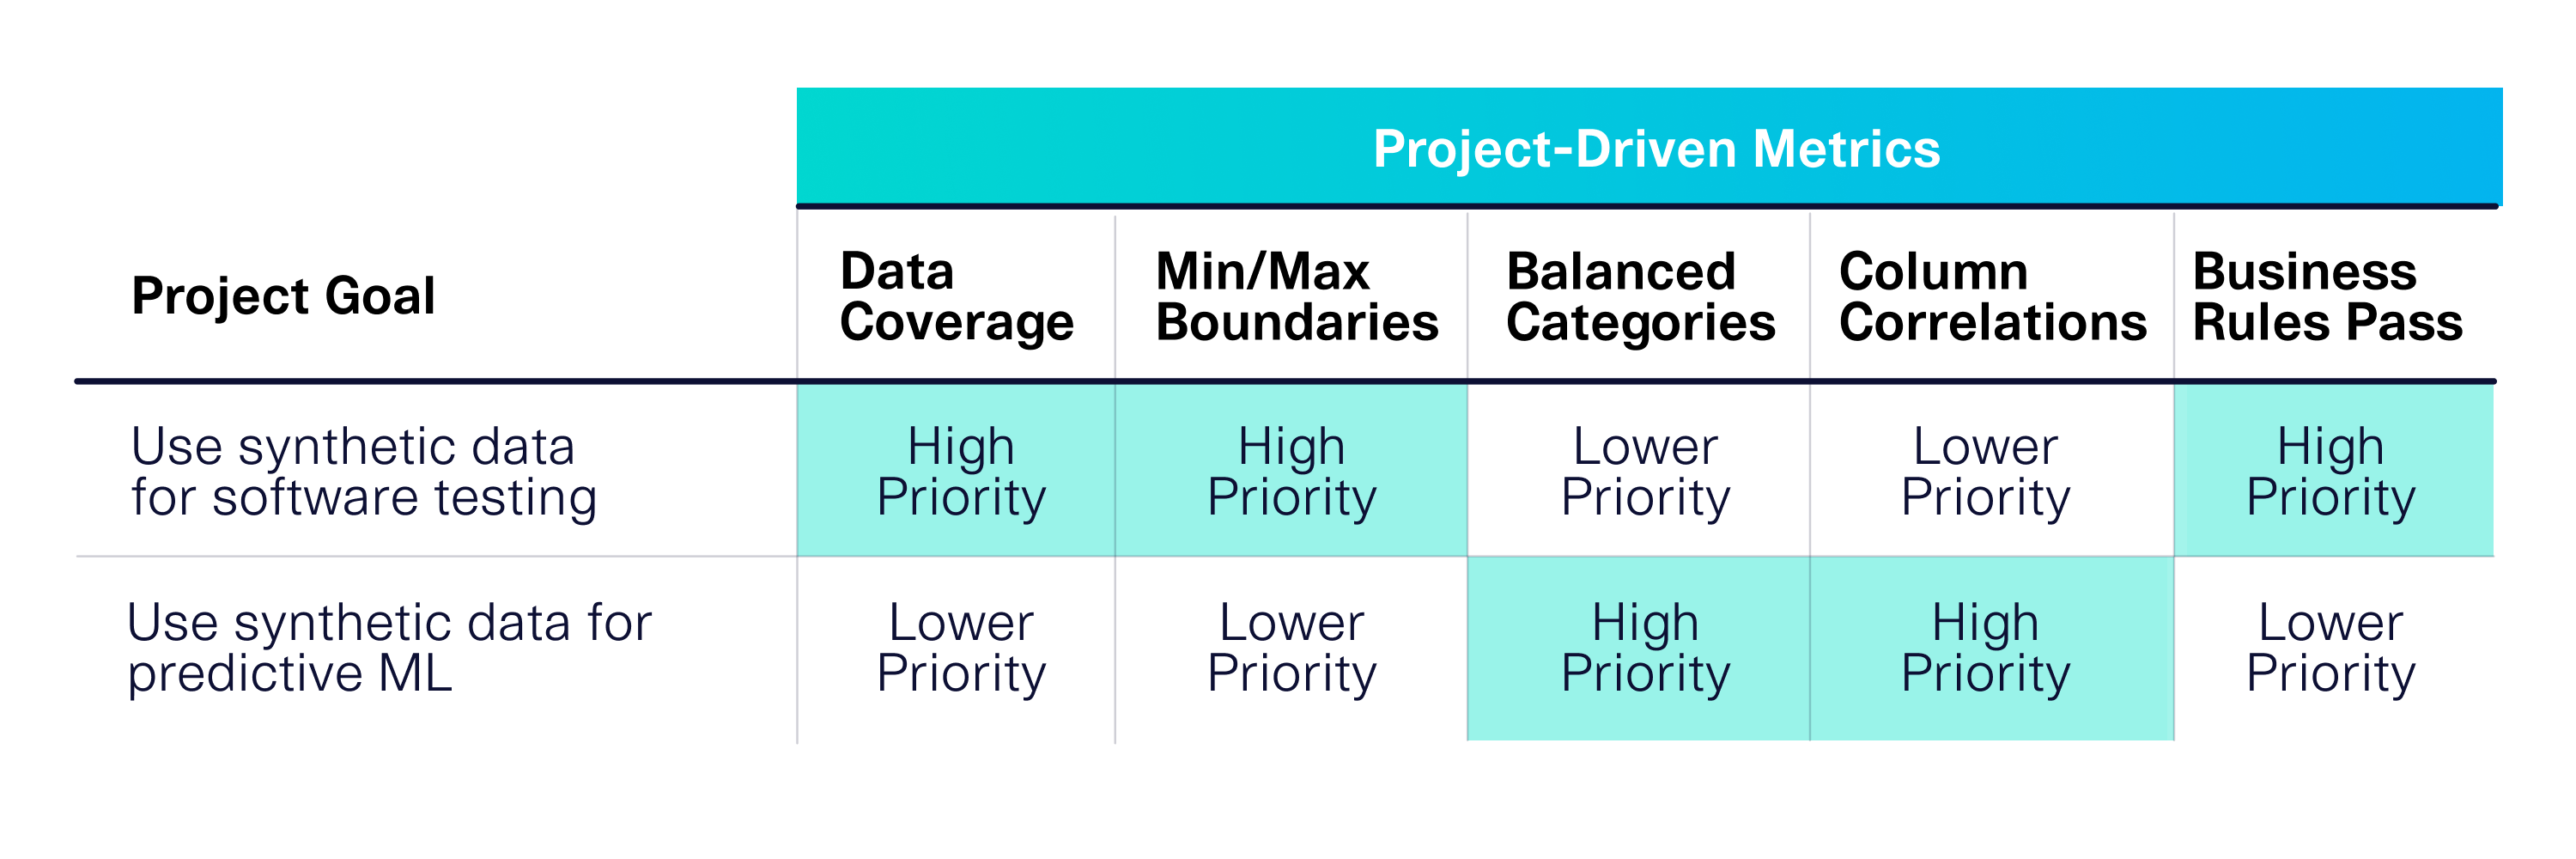
Focusing on your goals allows you to identify which metrics are important for the ultimate success of your project. The single biggest mistake we see people making is to skip this critical step. Without focus, you can easily get bogged down running multiple tests and tweaking your synthetic dataset, rather than meeting the specific considerations for your project. This can derail your efforts – leading to a complex project that doesn't add any value.
Step 2: Let your goals guide the synthetic data creation
Your goals can help you appropriately scope your project and cut costs. A core subset of metrics can guide your synthetic data creation, making it faster and more targeted to your needs.
Chances are, you'll be faced with many decisions throughout your project. For example, in the SDV library, there are 5 different algorithms that create synthetic data, each with their own settings that lead to hundreds of potential models you can create. But if you know that your synthetic data project is software testing, you've identified that coverage, boundaries and business rules are the highest priority metrics. This will guide your decision-making.
In this case, you may find success choosing our Gaussian Copula Synthesizer.. This model uses statistical methods to achieve your minimal requirements while also providing high performance – the Gaussian Copula Synthesizer can train a mid-size data table (100 columns and 100K rows) in only a few minutes. You can compare this to other GAN-based models that are more resource-intensive, taking hours to finish. If your project metrics are satisfied with Gaussian Copula Synthesizer, it is reasonable to choose this model over a GAN, even if it isn't perfectly optimized across all possible metrics.
From this example, we can see that metrics are not just something to evaluate at the end of the project – they are useful tools for decision-making throughout your project.
Step 3: Test the end-to-end workflow upfront
The purpose of metrics is to provide guardrails and focus for your project – scoping it so that you can drive business value most efficiently. For the highest chances of success, it's important to apply the synthetic data end-to-end for downstream applications, so that you can verify that business value upfront.
Continuing with our example of software testing, it's important to use the synthetic data for your downstream software testing suite as quickly as you can to verify the benefits of synthetic data. If you've chosen your metrics correctly and considered them when making decisions (steps #1 and #2), then you'll see that this translates to business value.
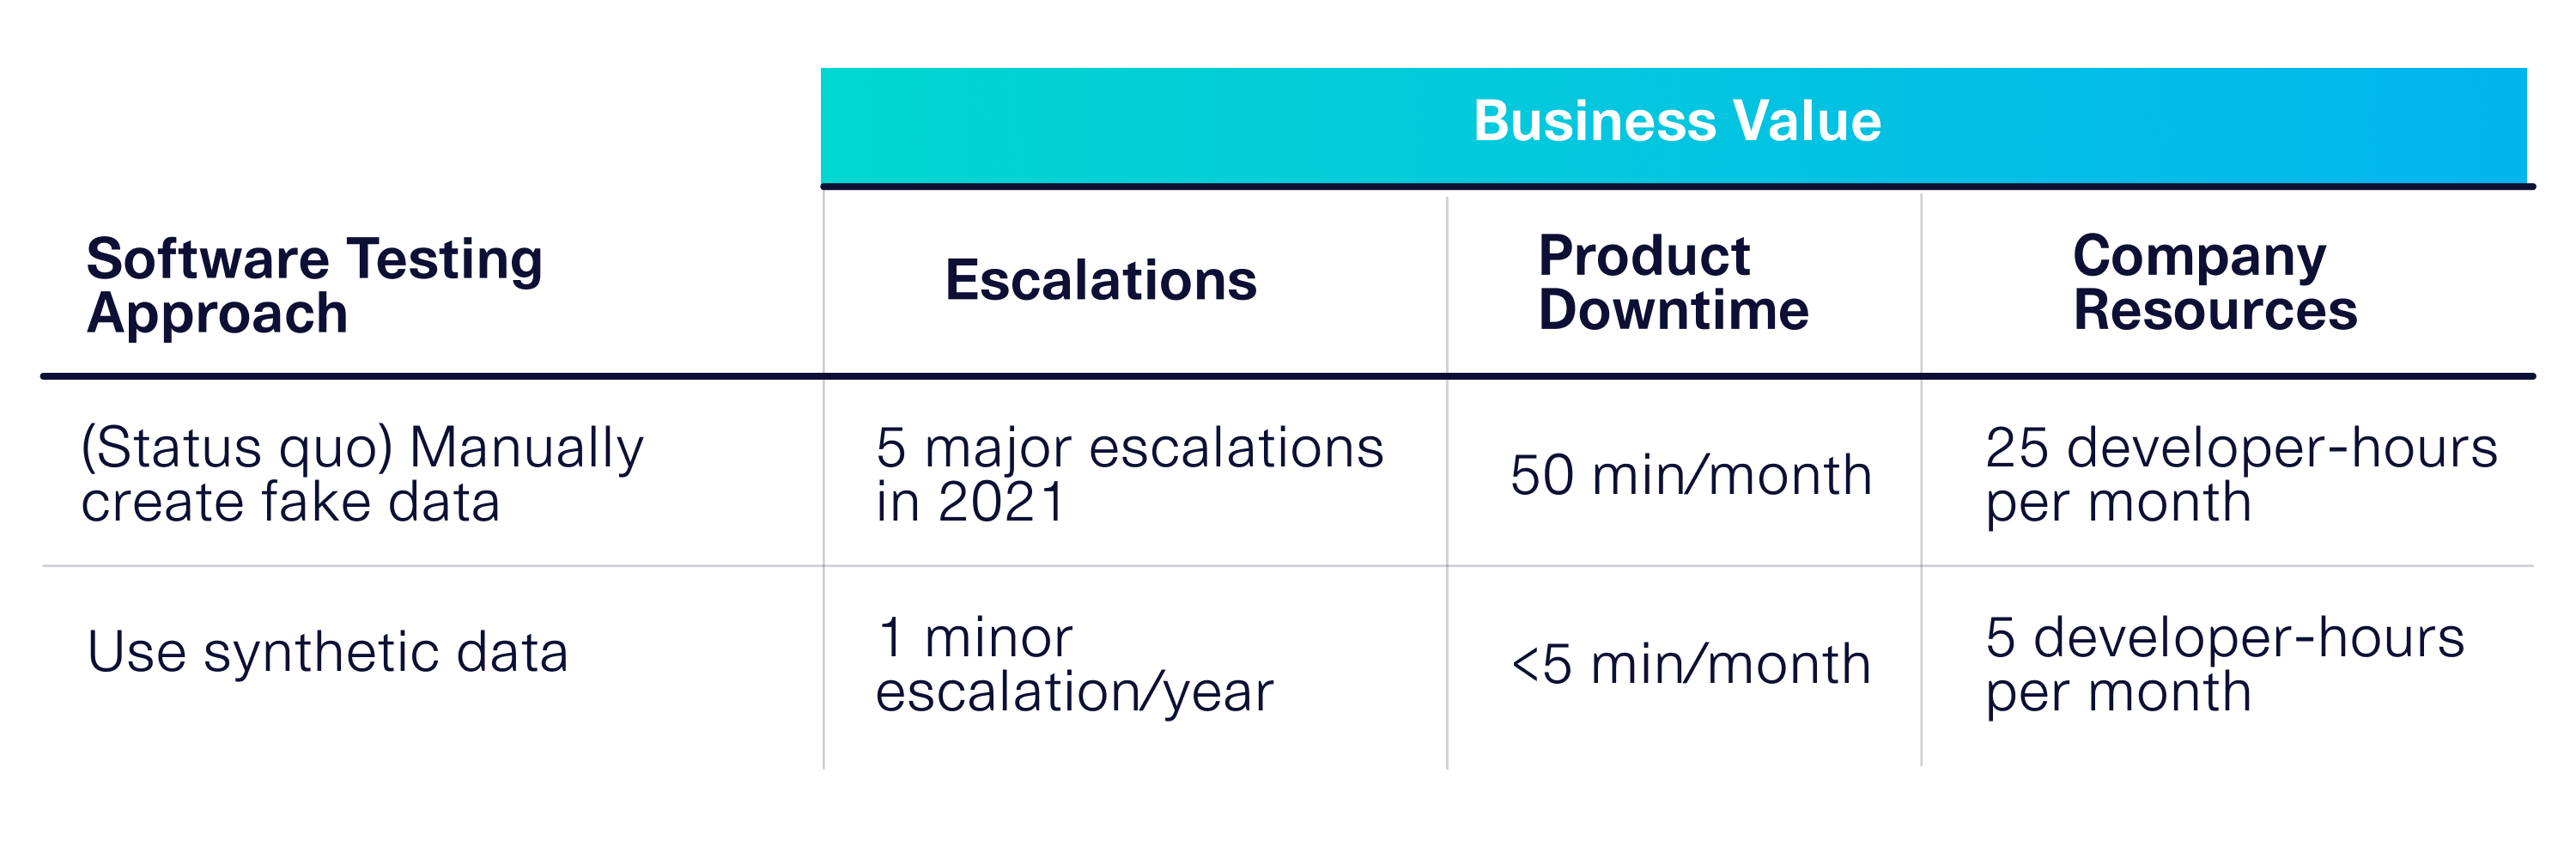
This type of cost-benefit analysis can help you make the case for synthetic data adoption within your enterprise. It can also help you iterate – to get more business value from your synthetic data, you can continue to optimize the metrics you've chosen in step #1, or identify new ones.
The Takeaway
Technically, there are an infinite number of metrics that could be used to evaluate synthetic data quality. The key to success is to incorporate select metrics into your synthetic data project development rather than just applying all metrics at the end.
Your project goals are critical to helping you choose the right metrics. Setting them upfront allows you to make better decisions during your project development. And going end-to-end allows you to measure the business value that your synthetic data brings to the organization.
What are your thoughts? Leave comments below! If you noticed other evaluation pitfalls in your projects, let us know below or reach us directly at info@sdv.dev.