
As the core maintainers of the Synthetic Data Vault project (SDV), our goal is to provide you with the tools to create high-quality synthetic data in an efficient and easy-to-understand way. With new software updates happening almost every month, you'll see our commitment to continue improving our software ecosystem.
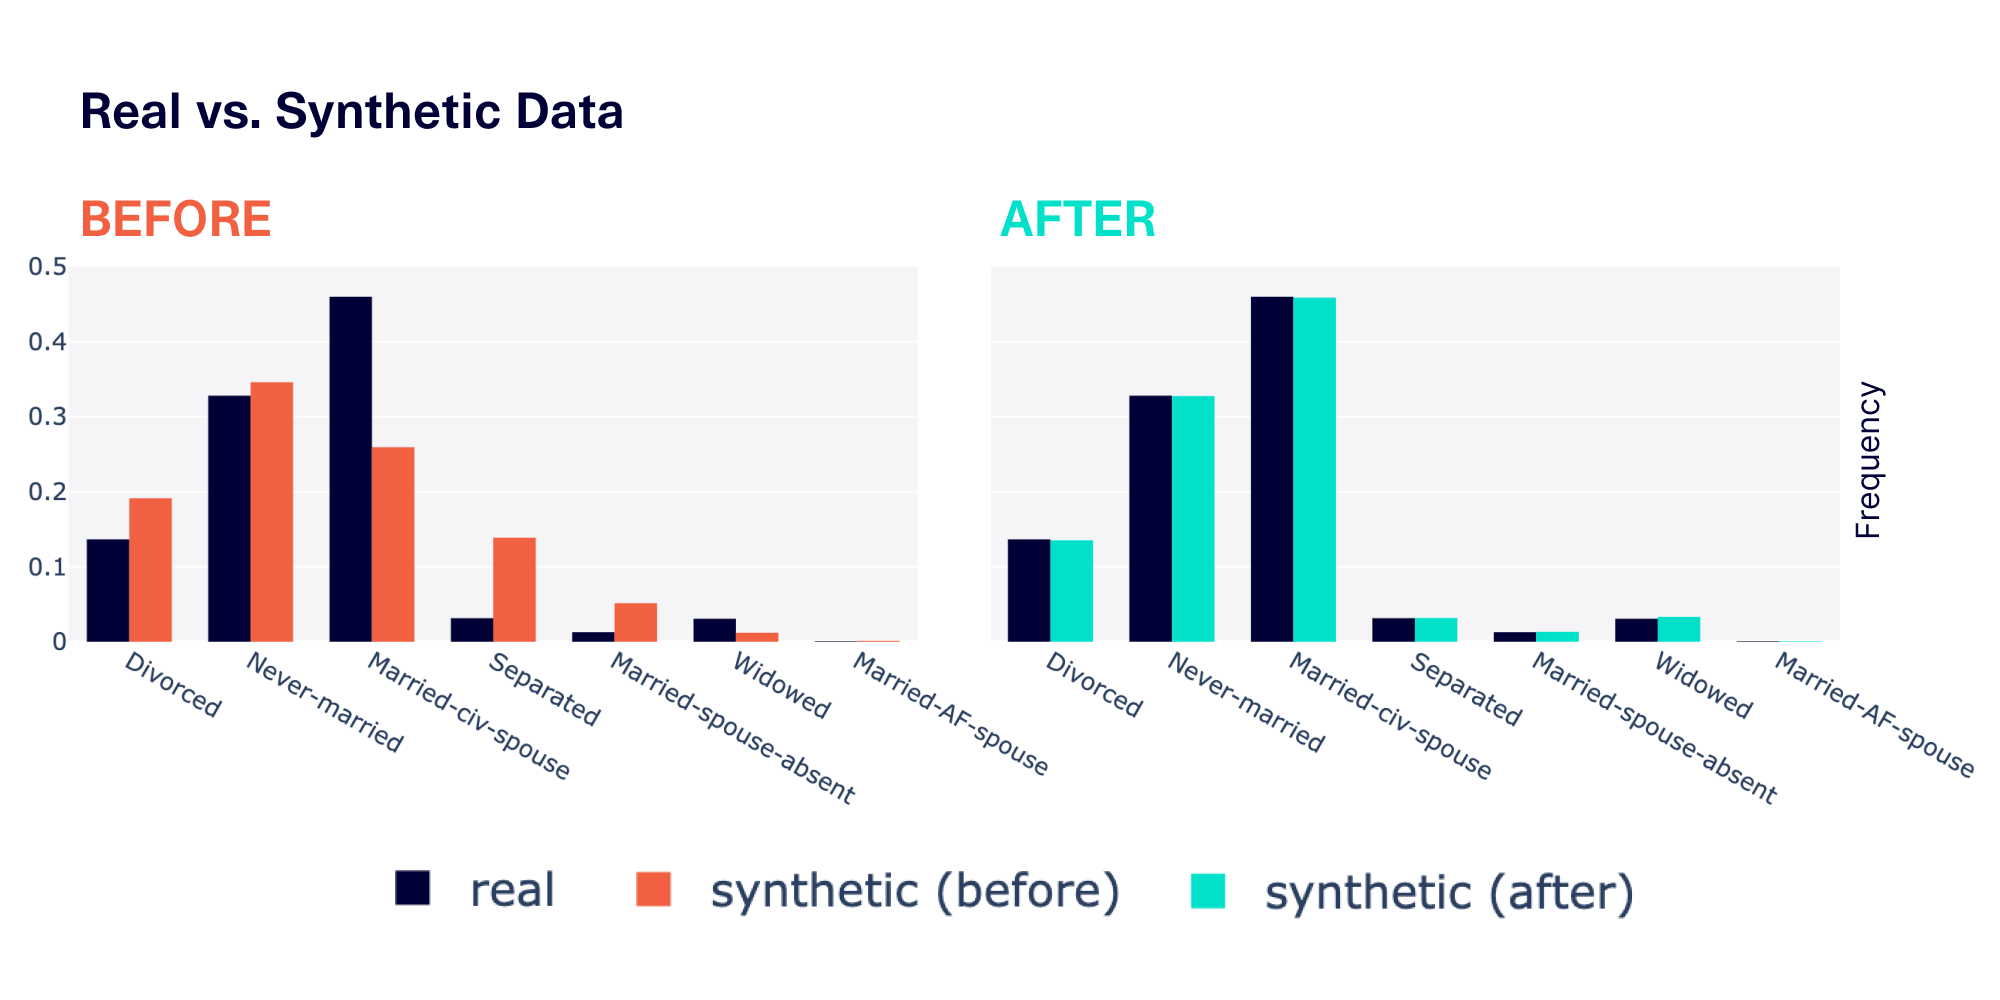
One of our most recent updates significantly improved the quality of synthetic data, especially for discrete attributes. Before, the synthetic data would roughly follow the same patterns as your real data — but now, it matches almost exactly. As of August 22, 2023, we're making this update publicly available, so that all users can reap the benefits.
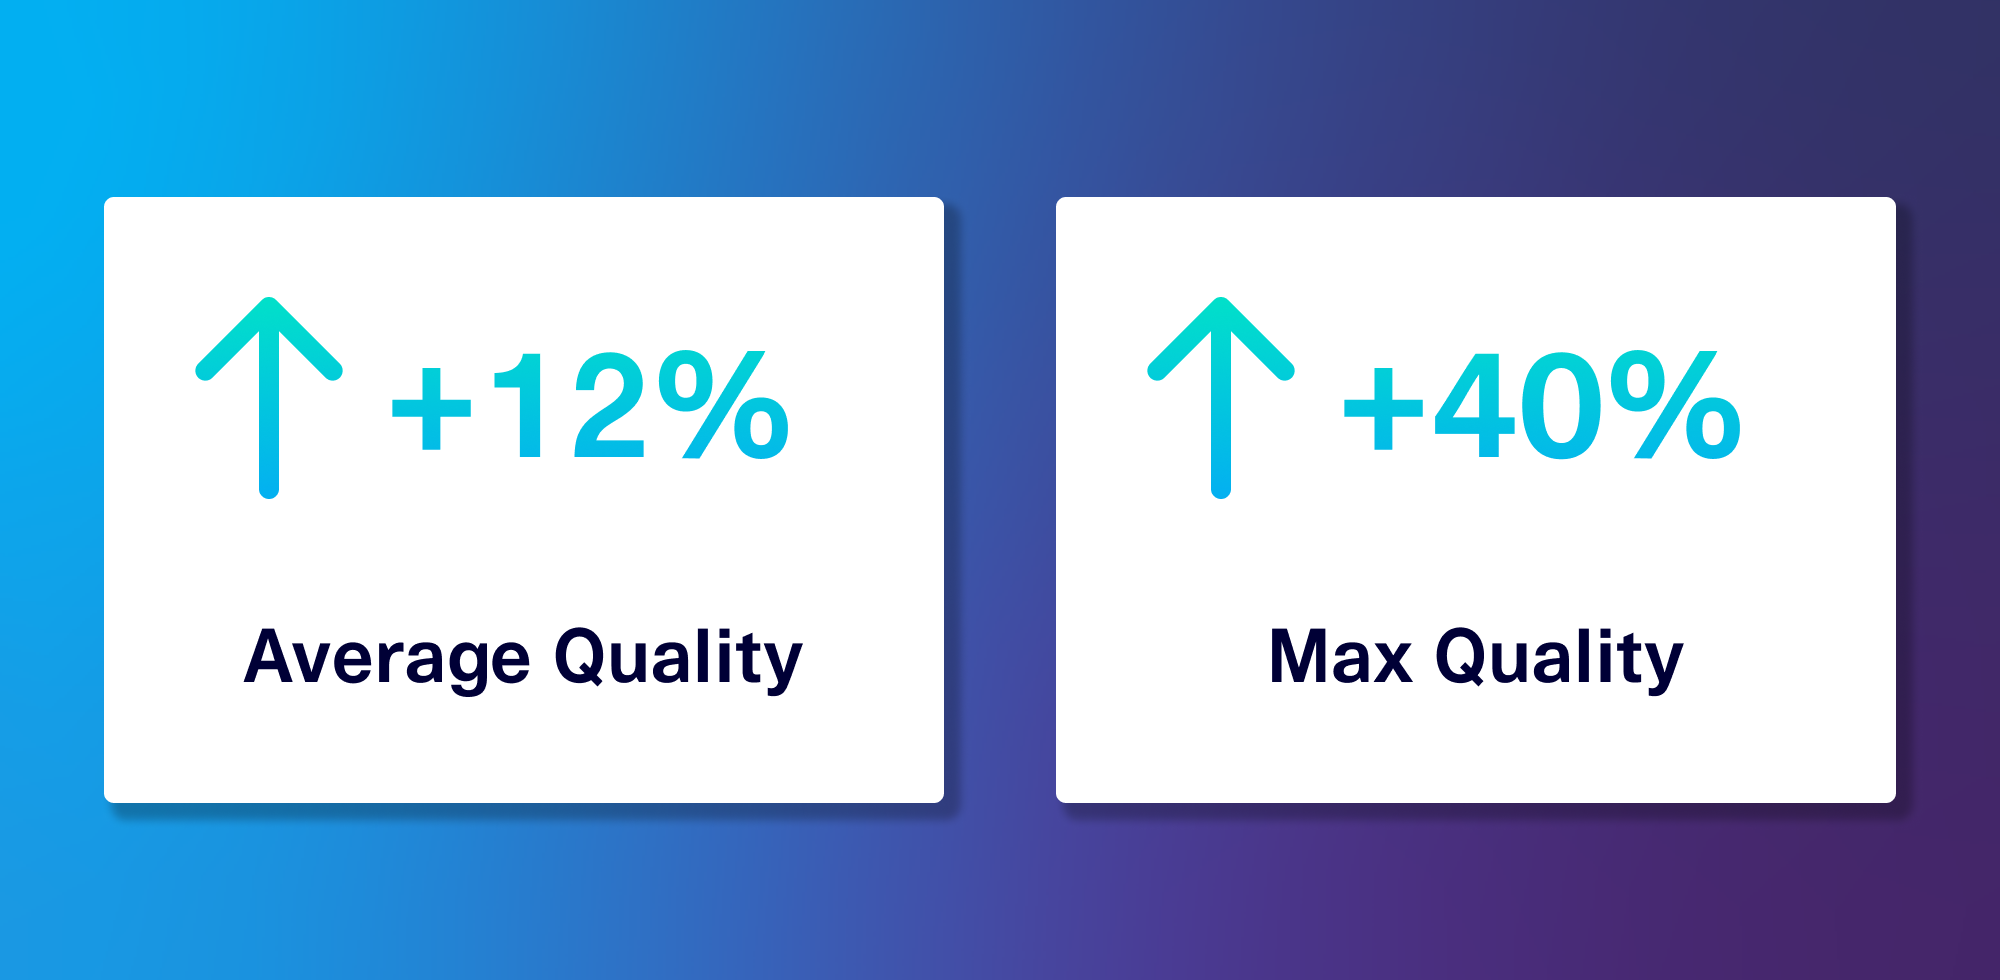
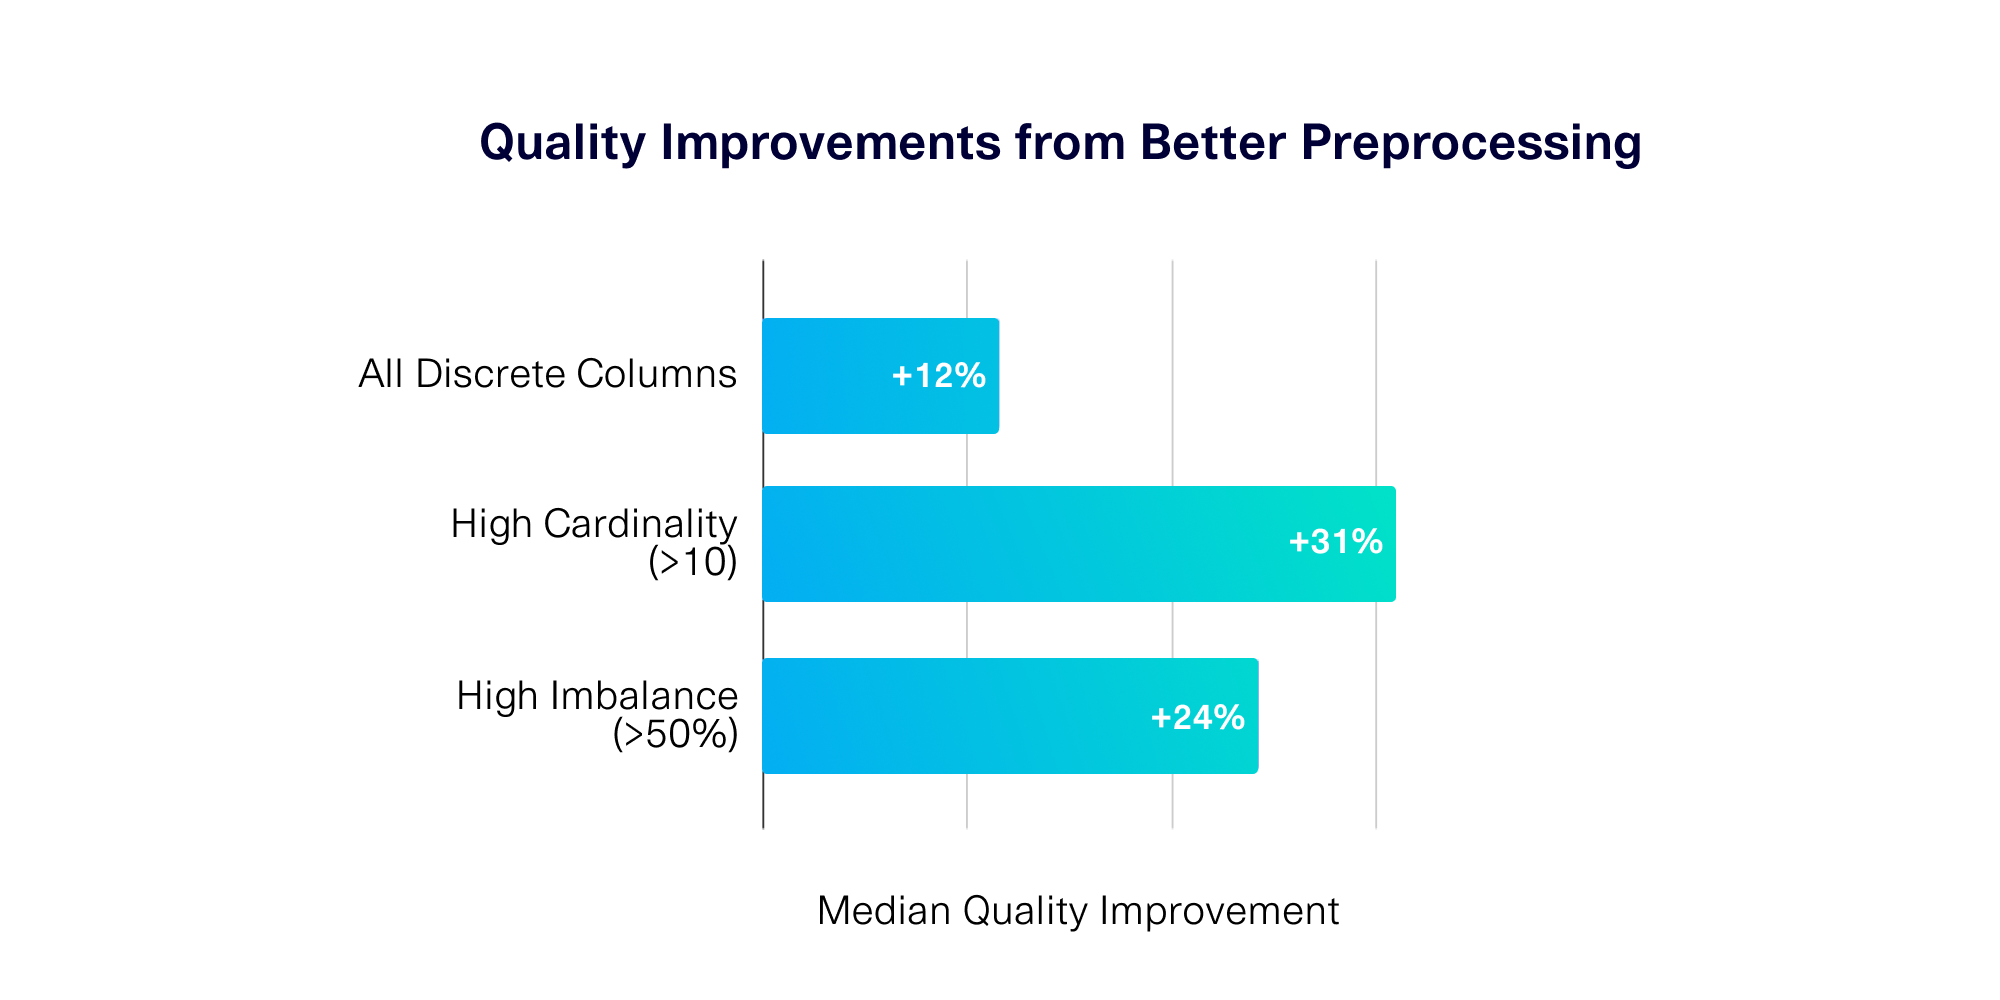
This upgrade came from a concerted effort to improve the synthetic data for discrete variables. Our results show that on average, you can expect a +12% quality improvement for discrete data, with some types of data even seeing up to +40% improvement. We've done this without reinventing our core ML algorithms or affecting their overall quality/performance.
In this article, we'll go through how we made these improvements and the methodology we use to evaluate their success.
Column properties that can cause problems
When setting out to improve the SDV, we start by clearly defining the problem we want to solve. We first identified this particular opportunity for improvement via user feedback: Some users had noted that the bar graphs of real vs. synthetic data differed in ways that had important implications for their projects.
We can measure the quality of synthetic data using the TVComplement metric. This computes the total variation between the real and synthetic data, i.e. the total differences between the bars in a bar graph. The higher the difference, the lower the quality.
We created synthetic data for datasets in the SDV demo module, and observed that the quality was especially affected when the dataset had specific properties.
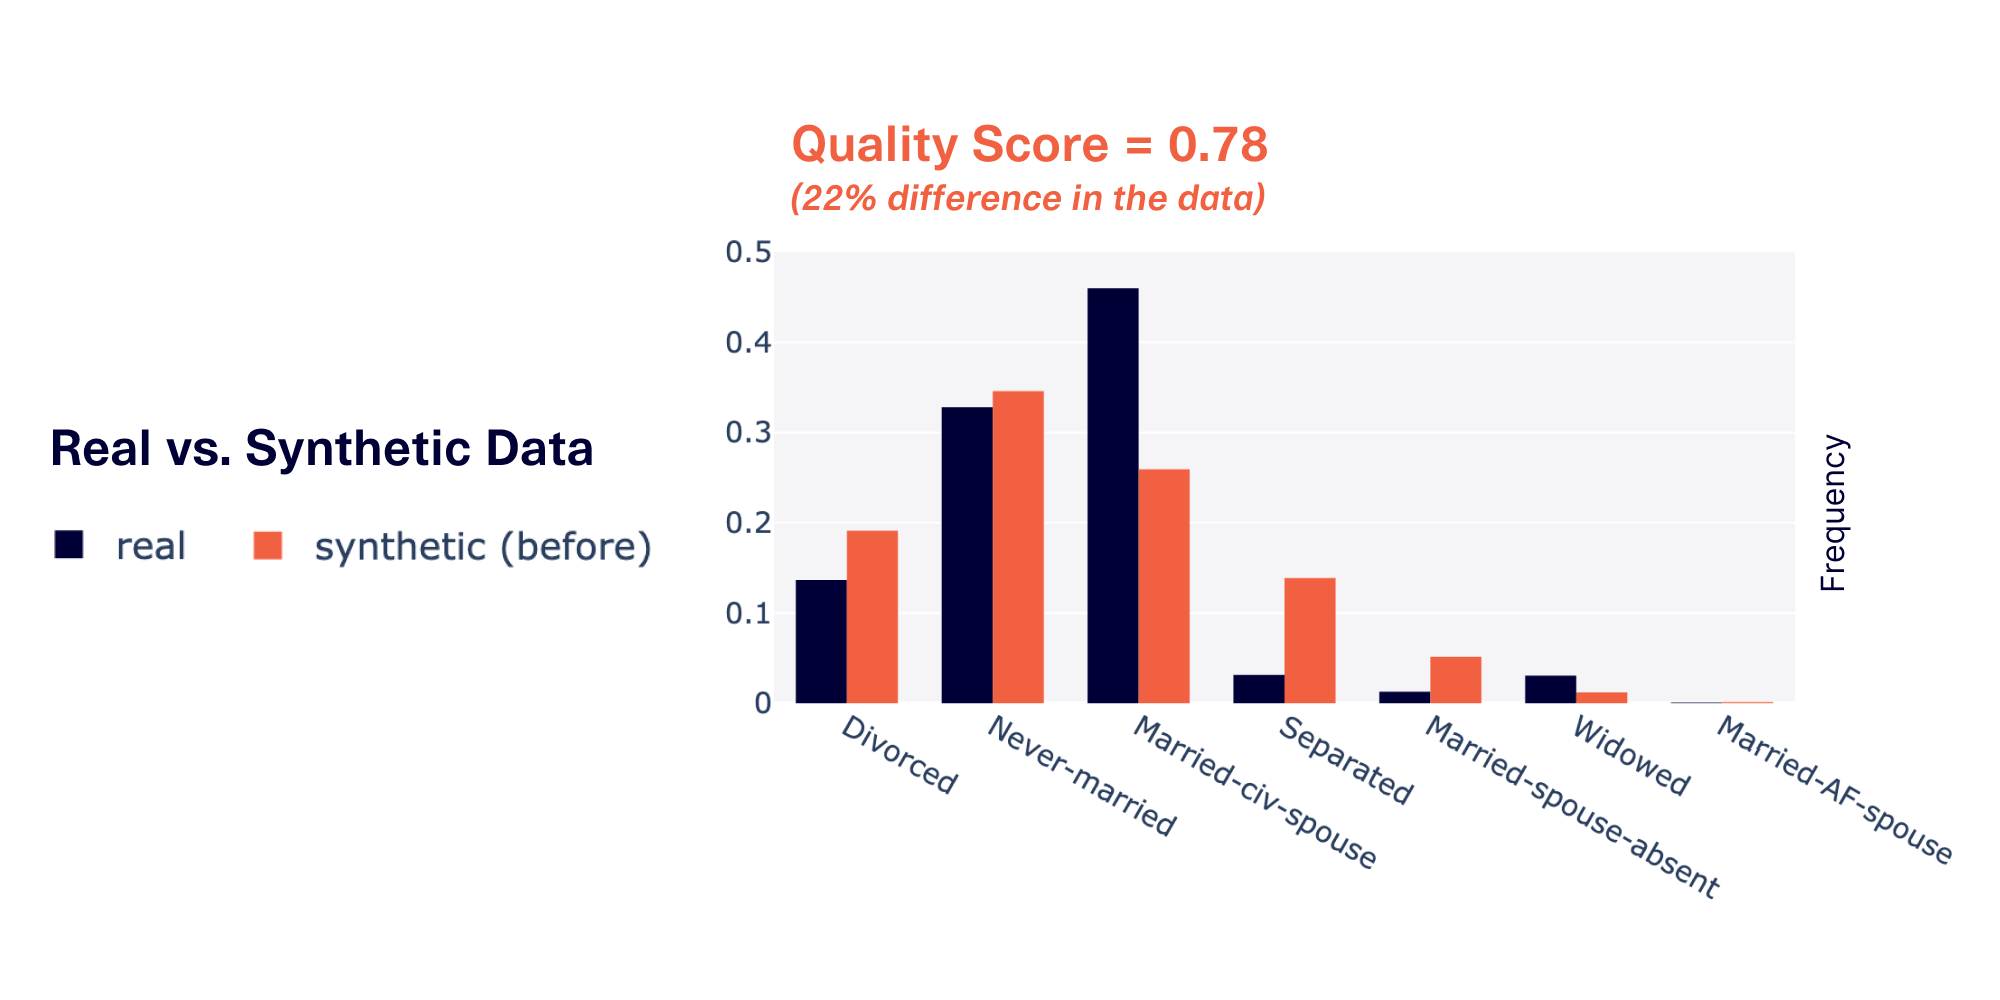
- High cardinality reduced quality by 36%. The cardinality of a discrete data column describes the total # of possible categories. For example, the
marital-statuscolumn has a cardinality of 7, since it has 7 different categories ("Divorced", "Never-married", etc.). We found that as the cardinality increased, the quality became worse. When the cardinality was >10, the quality fell to 0.64. - High imbalance reduced quality by 28%. The imbalance of a discrete column describes how biased it is towards particular categories. To compute imbalance, we can take the total variational distance between the data in a column and perfectly even (uniform) data. We found that greater imbalances led to worse quality. Columns with an imbalance of over 50% had a quality at around 0.72.
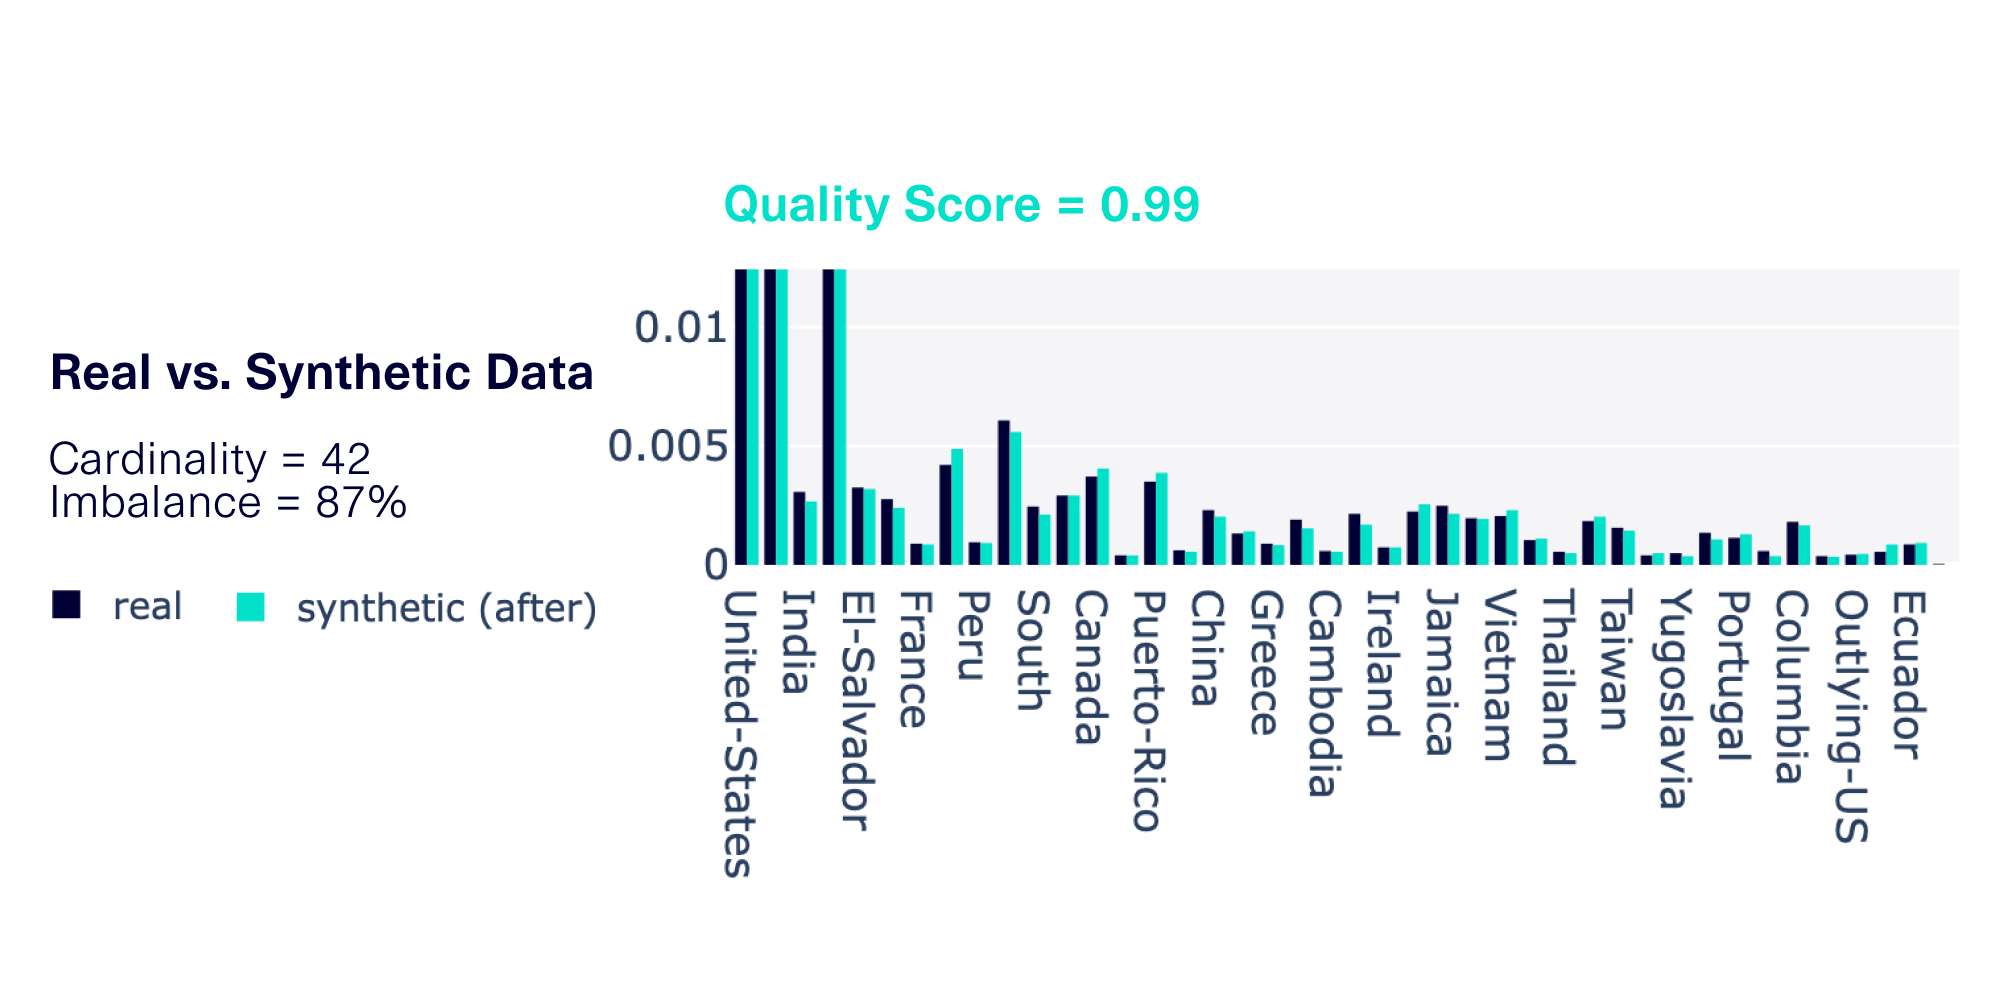
The graph below provides an example of one such data column with both high cardinality and high imbalance.
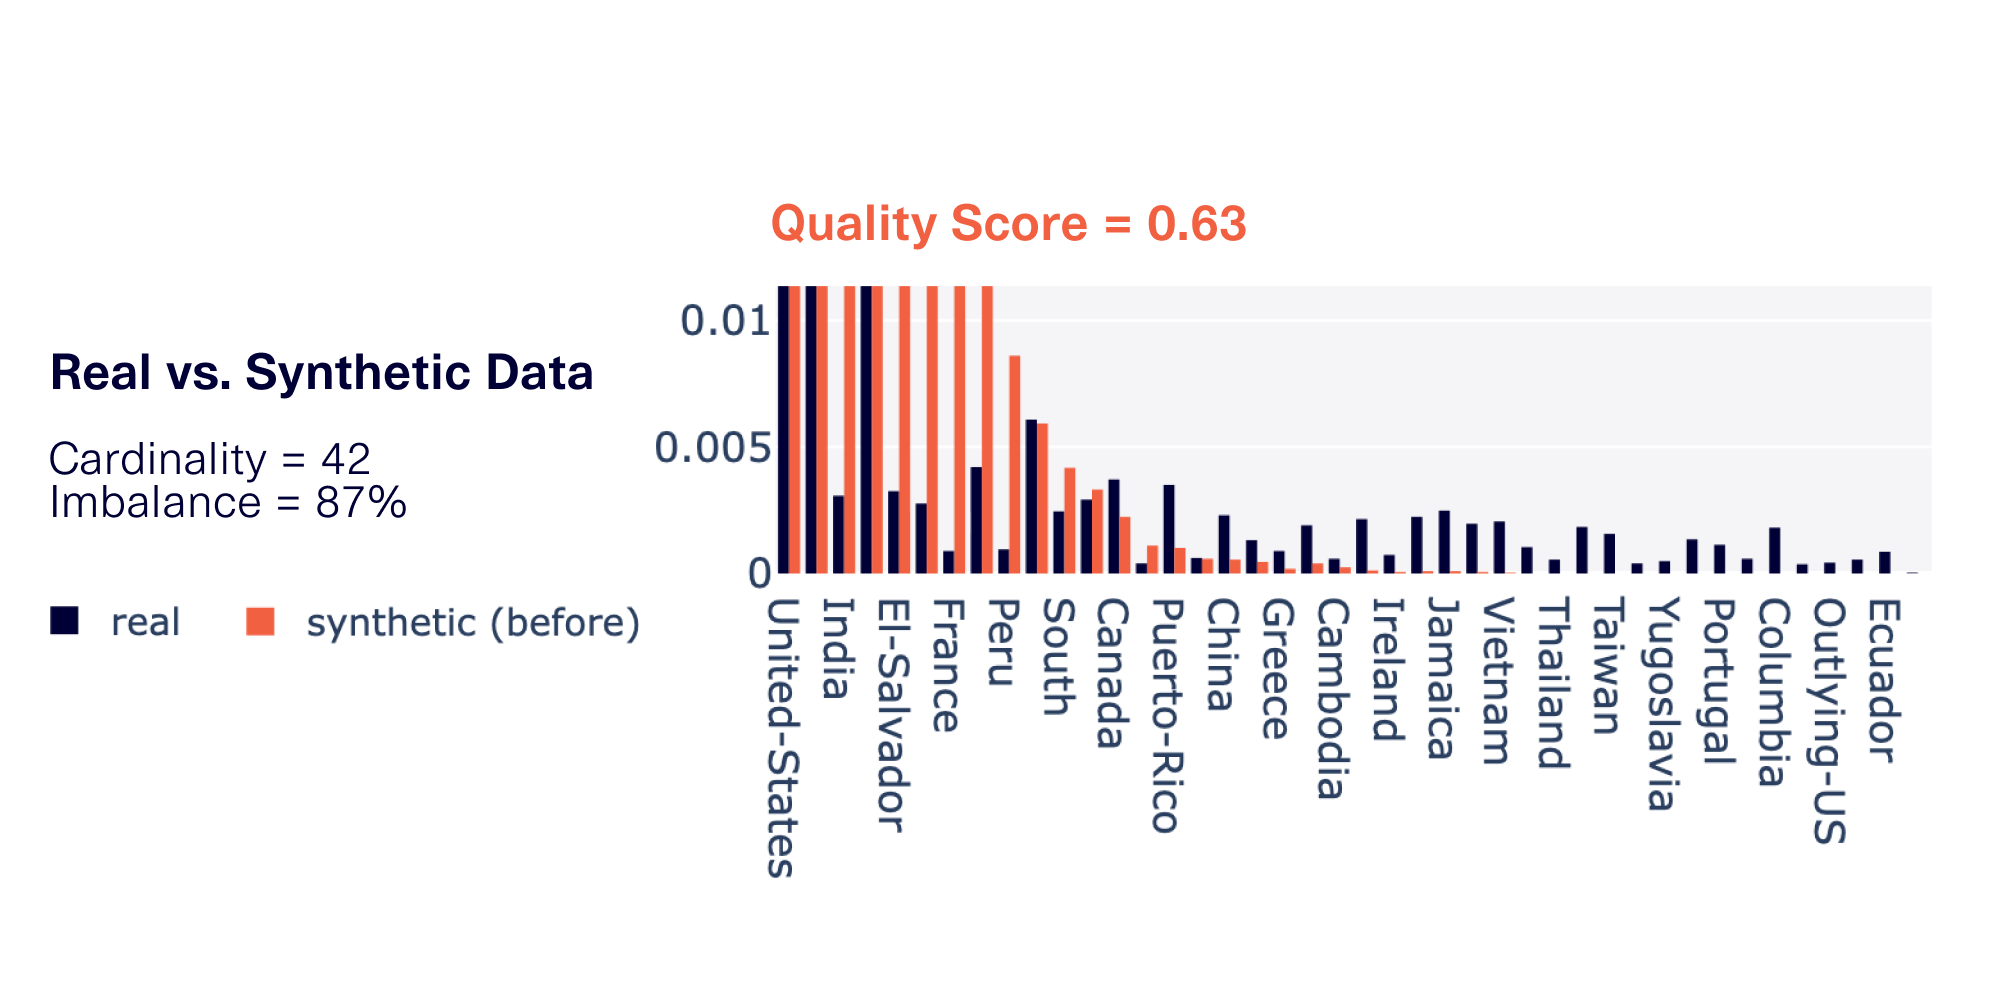
High cardinality and high imbalance can occur in many different datasets across a variety of domains. For example, country information, as shown in our graph, might be prevalent in different sectors:
- Government records may store country as part of a census
- Financial institutions may store the country as part of international bank transfers
- E-commerce sites may store the country for shipping purposes
Cardinality and imbalance issues can also compound. If your data has both properties, this could lead to poor CategoryCoverage in the synthetic data — that is, some categories may never appear in the synthetic data, even after taking thousands of samples.
Fixing the preprocessing leads to better data for the generative algorithm
Oftentimes, our instinct when tackling a problem is to try to improve the generative algorithm. However, after years of innovating in the synthetic data space, we know that this is far from the only way to improve synthetic data. There are often more elegant ways to fix these issues.
Earlier this year, we laid out an abstracted workflow that allows all SDV synthesizers to go through 5 distinct steps. If we only focus on the traditional ML steps, we are missing out on other opportunities to improve.
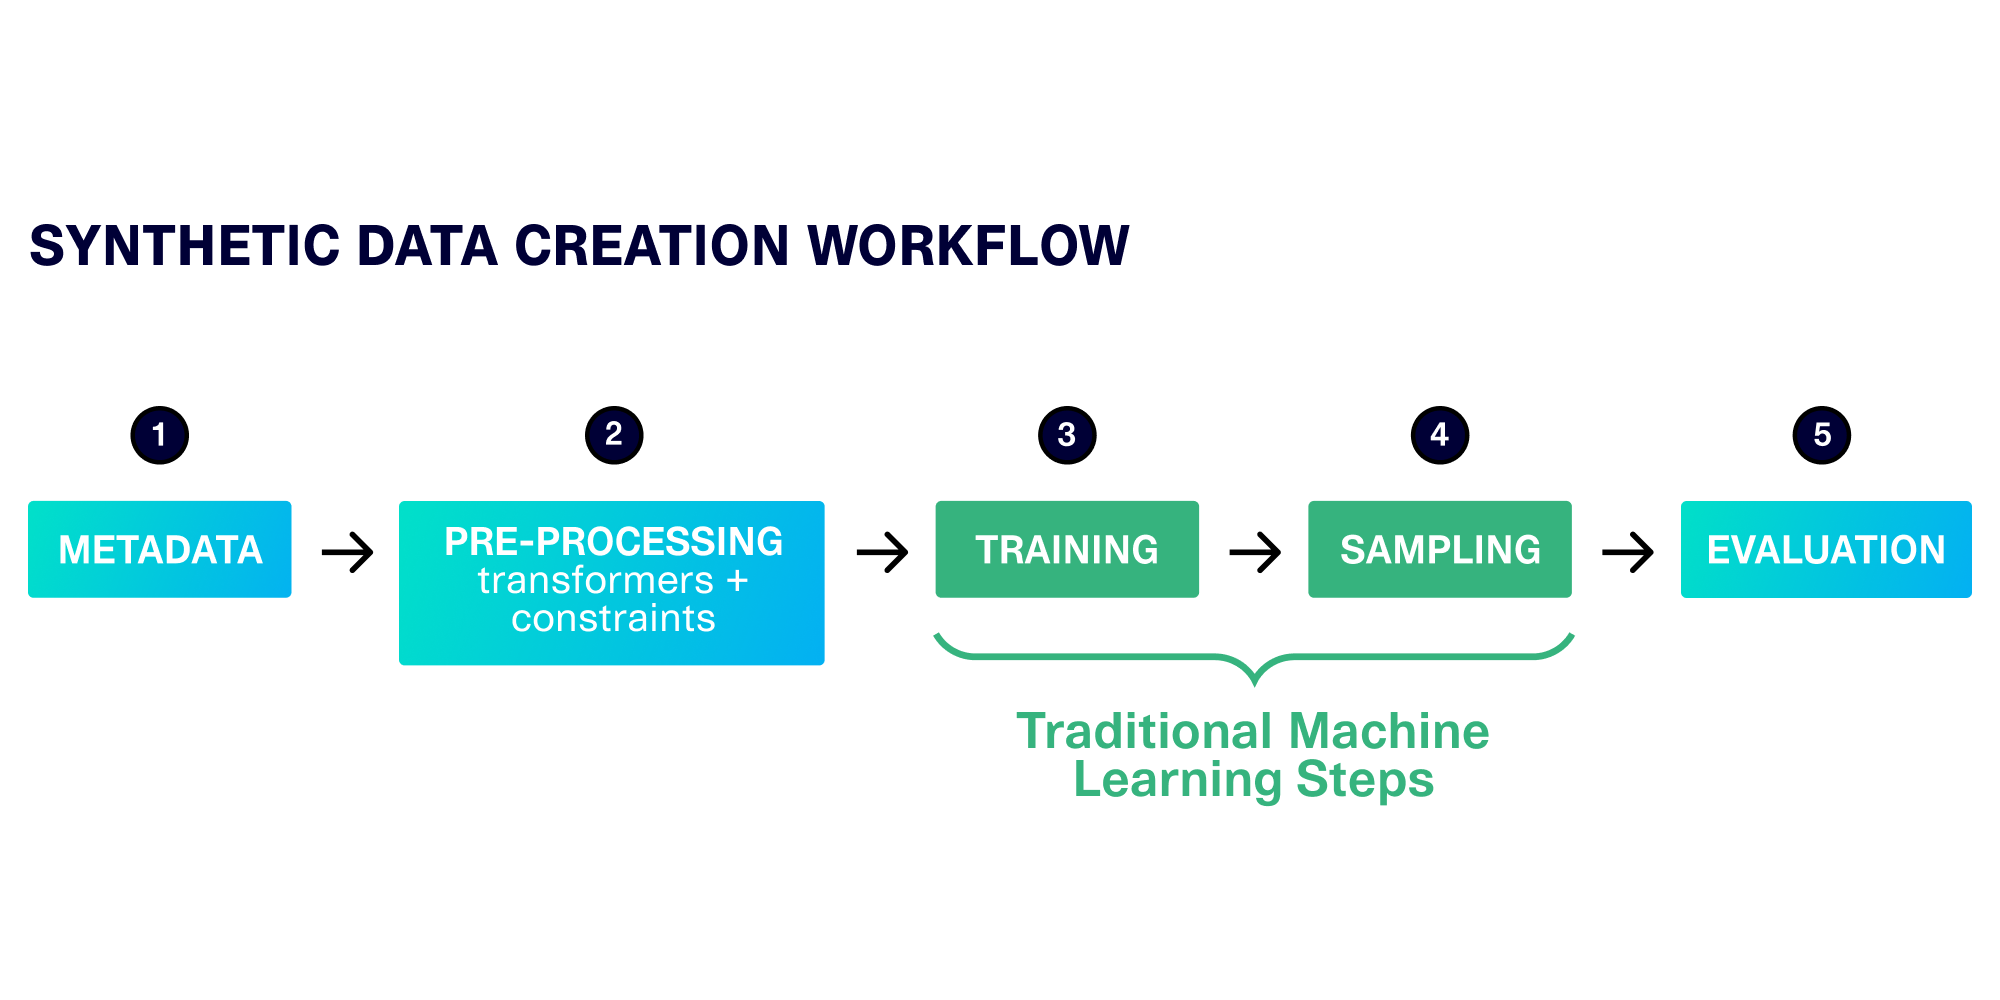
For this issue, we honed in on the preprocessing stage. Since many ML algorithms expect fully continuous, numerical data, we use specific methods to preprocess discrete data into a continuous format. What would happen if we improved that preprocessing, and helped the ML algorithm better understand the patterns? This way, we would not need to modify the underlying ML software, which has been working well for other types of data.
Sure enough, the results supported our hypothesis. Just from updating the preprocessing stage, we observed significant improvement in data quality, especially for cases of high cardinality and high imbalance.
These improvements were reliable across 14 SDV demo datasets. The graph below summarizes our learnings.
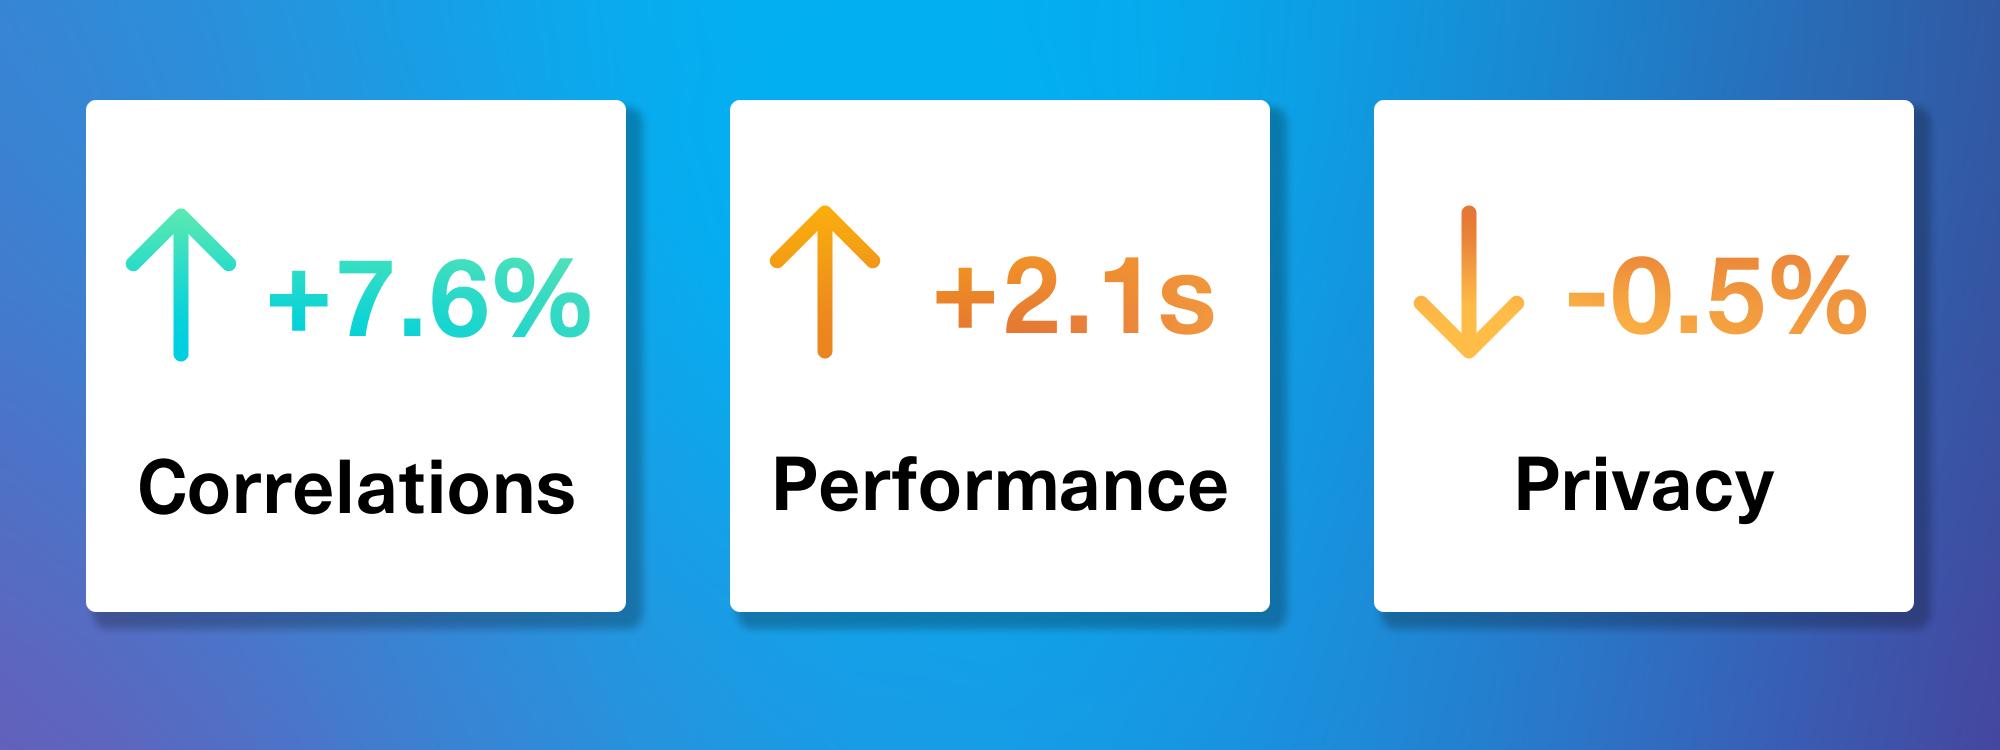
Correlations, performance and privacy remain unaffected.
We conducted a more holistic assessment to verify that other aspects of the synthesizer (quality, performance, privacy, etc.) were not adversely affected by this change. The results were encouraging:
- No column's quality score was adversely affected by our changes. When considering the pairwise correlations inside the entire dataset, we saw an average improvement of 7.16%. This indicates that improvement in one aspect of synthetic data (discrete column quality) works synergistically with other aspects of synthetic data (correlations).
- With our new changes, the processing time only increased by an average of 2 seconds. To put this into context, a larger dataset of around 100MB can still be modeled in <2 min using our most efficient SDV synthesizers. This shows that it's possible to make improvements to synthetic data without increasing computational demands.
- The loss of privacy was less than 0.5%, as determined by the NewRowSynthesis metric. This measure holistically identifies if any rows match between the real and synthetic data. High privacy indicates that synthetic data quality and privacy are not always at odds. When we improve the quality of lower-dimensional measures (such as an individual column's shape), it does not meaningfully impact the privacy of the higher-dimensional data (such as the entire row).
After verifying these results with SDV Enterprise customers, we decided to make this new preprocessing available to the public. Anyone who uses the publicly available SDV library can now see improvements in their synthetic data. Get started by installing the SDV or upgrading your preprocessing software.
%pip install sdv
%pip install rdt -U
After updating, you can use the SDV as usual. The SDV synthesizers will automatically choose the new preprocessing methods that improve your synthetic data quality.
How does it work?
For the technically inclined, we'll spend this final section going over the details of our improved preprocessing method.
Preprocessing is an important aspect of synthetic data because many ML algorithms require fully continuous data in order to work. This data must be numerical with no missing values. Because real data rarely has these properties, it's generally necessary to preprocess it into a usable format. (All SDV synthesizers use the RDT library to accomplish this.)
Before we made our improvements, we were using the LabelEncoder to convert discrete data into numerical values. This encoder assigns values (0, 1, 2, …) to each unique category in the data. In order to make the data continuous, it adds some noise, so that 0 is mapped to the [0, 1) range, 1 is mapped to the [1, 2) range, etc.
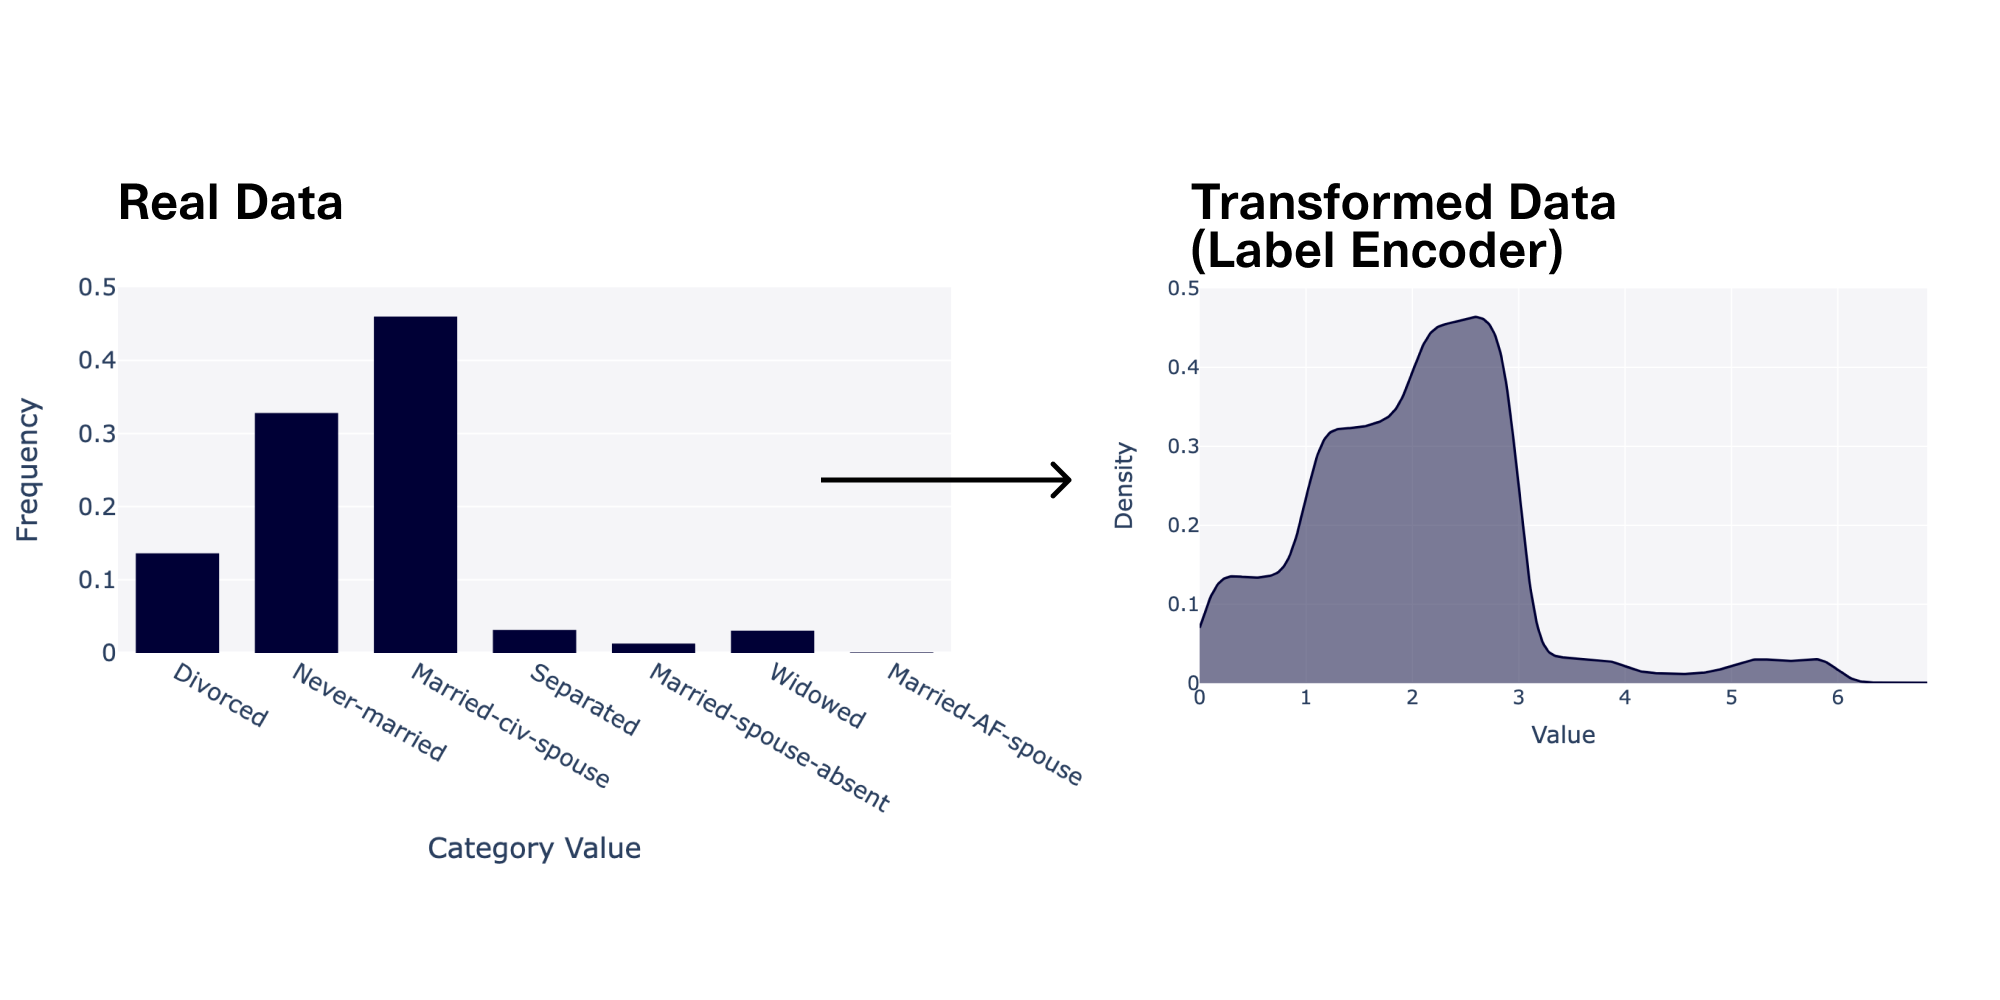
This type of data can be used for ML because it is continuous and numerical. However, the precise shape of the data may be difficult for the algorithms to learn. Our ML algorithms typically summarize these shapes into common mathematical distributions such as bell curves or straight lines, rather than maintaining the actual peaks, bumps and other anomalies in the real data. This means some complexity and detail is lost – leading to a lower quality in the synthetic data.
Introducing the Uniform Encoder
Our innovation in this space is the UniformEncoder, which uses a new algorithm we invented to better understand the discrete data. This encoder aims to get rid of any peaks and valleys in the data by assigning different weights to each category, resulting in a smooth line. As its name implies, the numerical data that it produces looks like a flat, uniform distribution.
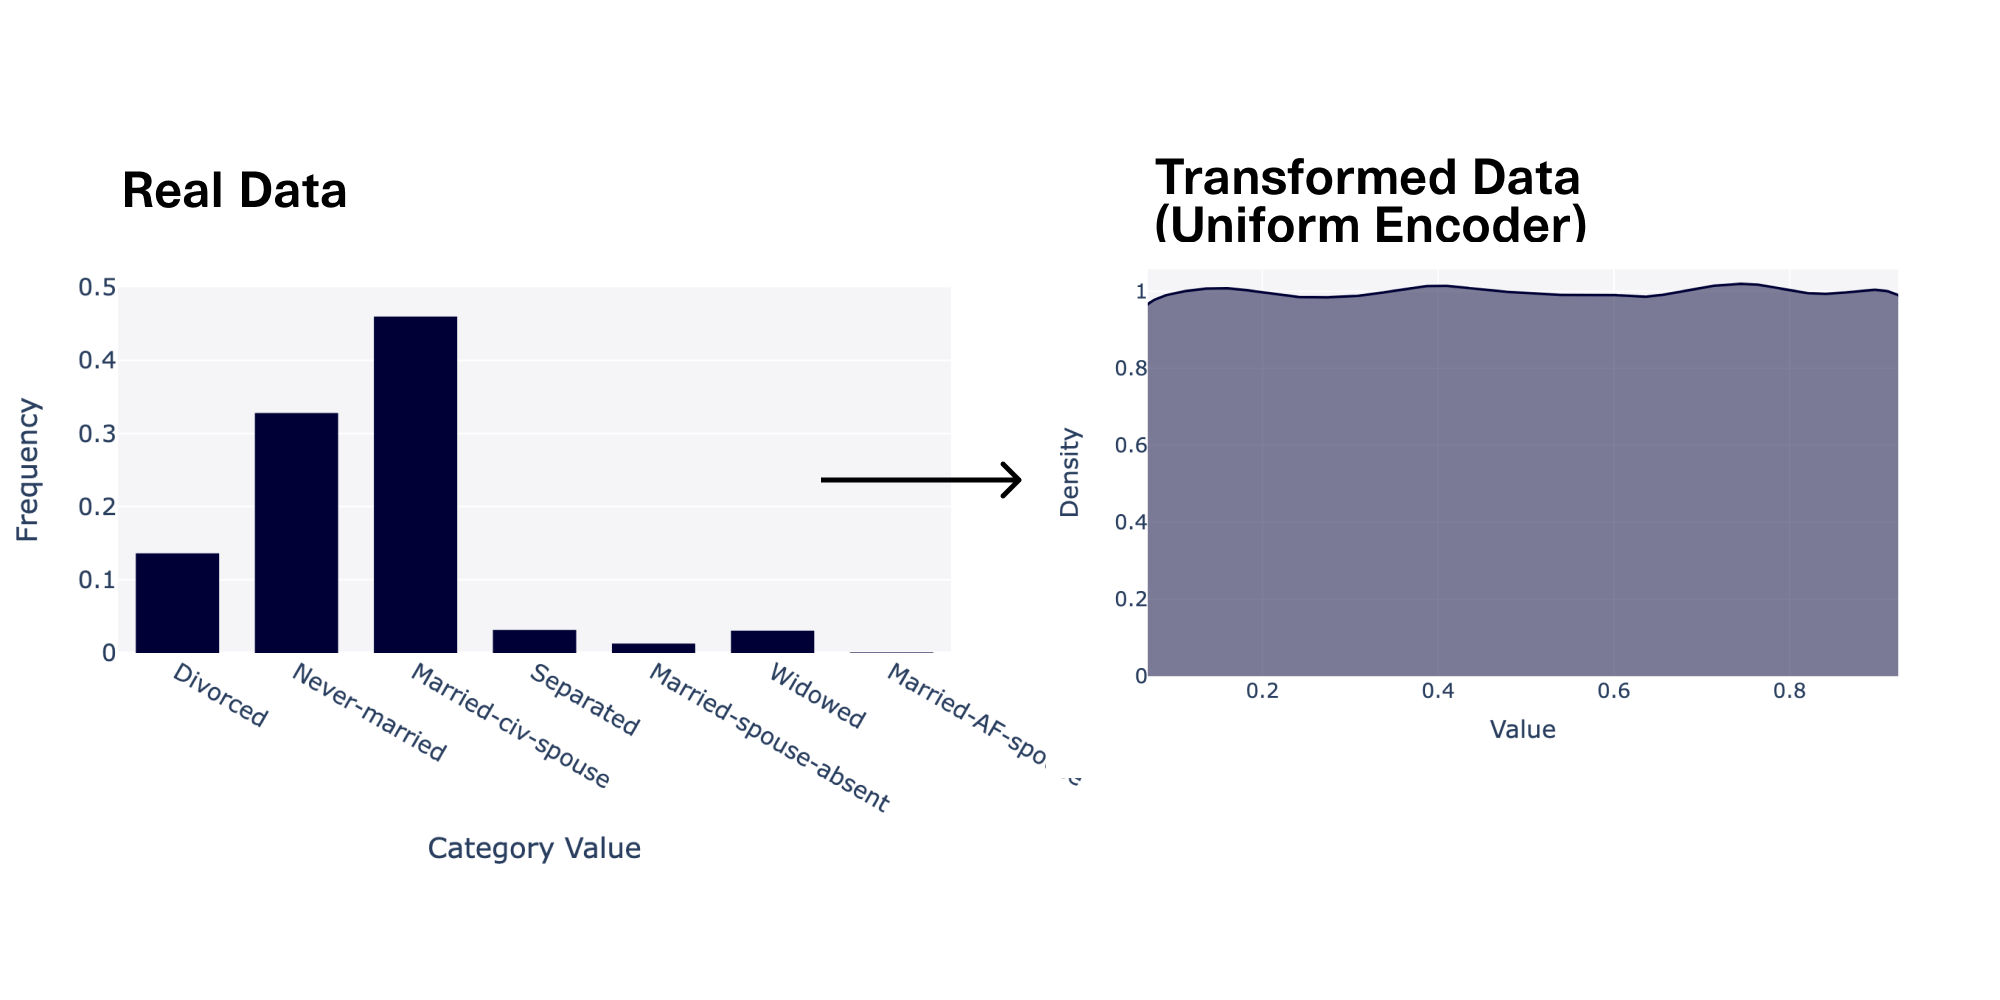
The key idea behind this transformer is to add more intelligence during the data preprocessing stage, so that the ML algorithm does not have to do as much work. In fact, flat uniform distributions are extremely easy for almost all ML algorithms to understand and recreate. It's also important to remember that the original information is not lost. The UniformEncoder remembers the true category values, so it's easy to reverse the transformation back to data in the original shape.
In summary, this approach shifts responsibility for learning a discrete distribution to the preprocessing stage, rather than expecting the ML algorithm to do it all. This way, we are able to apply the transformer to any of the SDV synthesizers and produce high quality synthetic data.
What's Next?
Head over the SDV library to begin exploring high-quality synthetic data creation. The custom transformation demo provides more information on how to customize the preprocessing stage of your synthetic data workflow.
Did you like this content? Leave us a comment below, or join us on Slack to share your thoughts.